The documentation of HiChIPdb
Home page
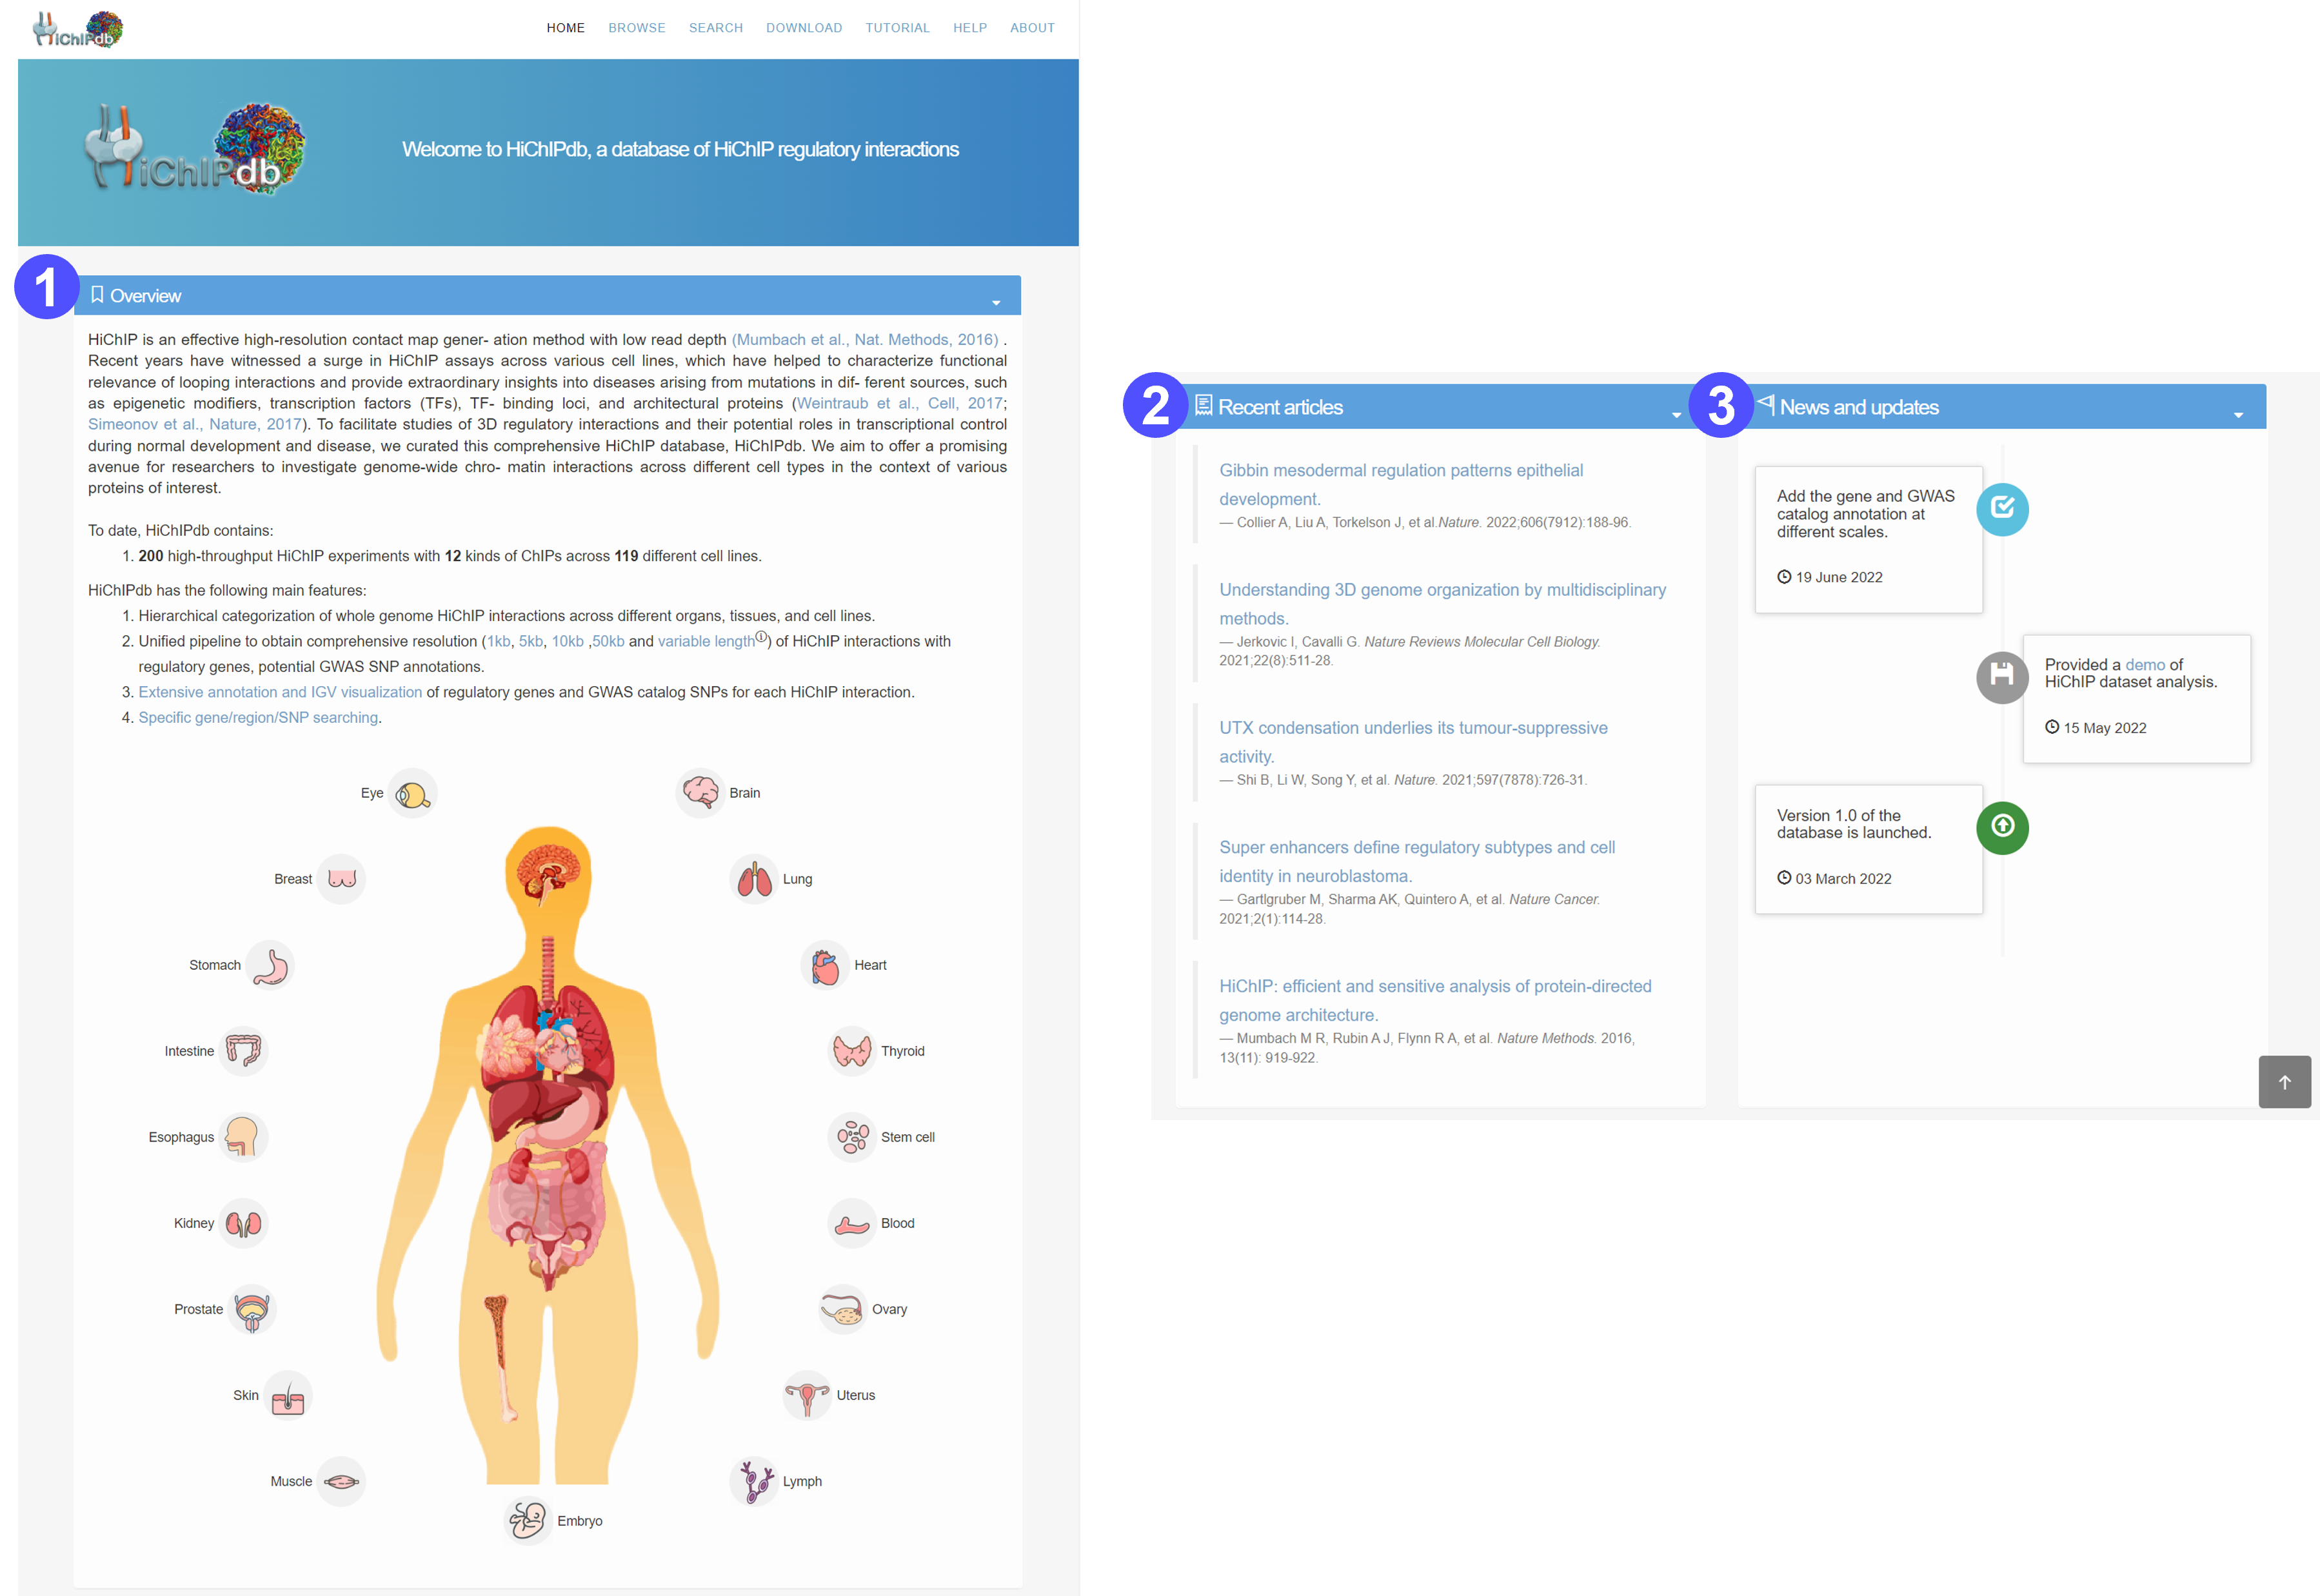
- A simple introduction about the database, with a global view of body maps of human.
- The body maps facilitate the quick browse of HiChIP regulation map across various organs and cell types.
- The HiChIP regulation map in different cell types can be accessed by clicking the organ icons.
- After a specific cell type, it will jump to the corresponding Browse page to show more details.
- Recent articles about HiChIP techniques and HiChIP application.
- News and updates of HiChIPdb.
Browse page
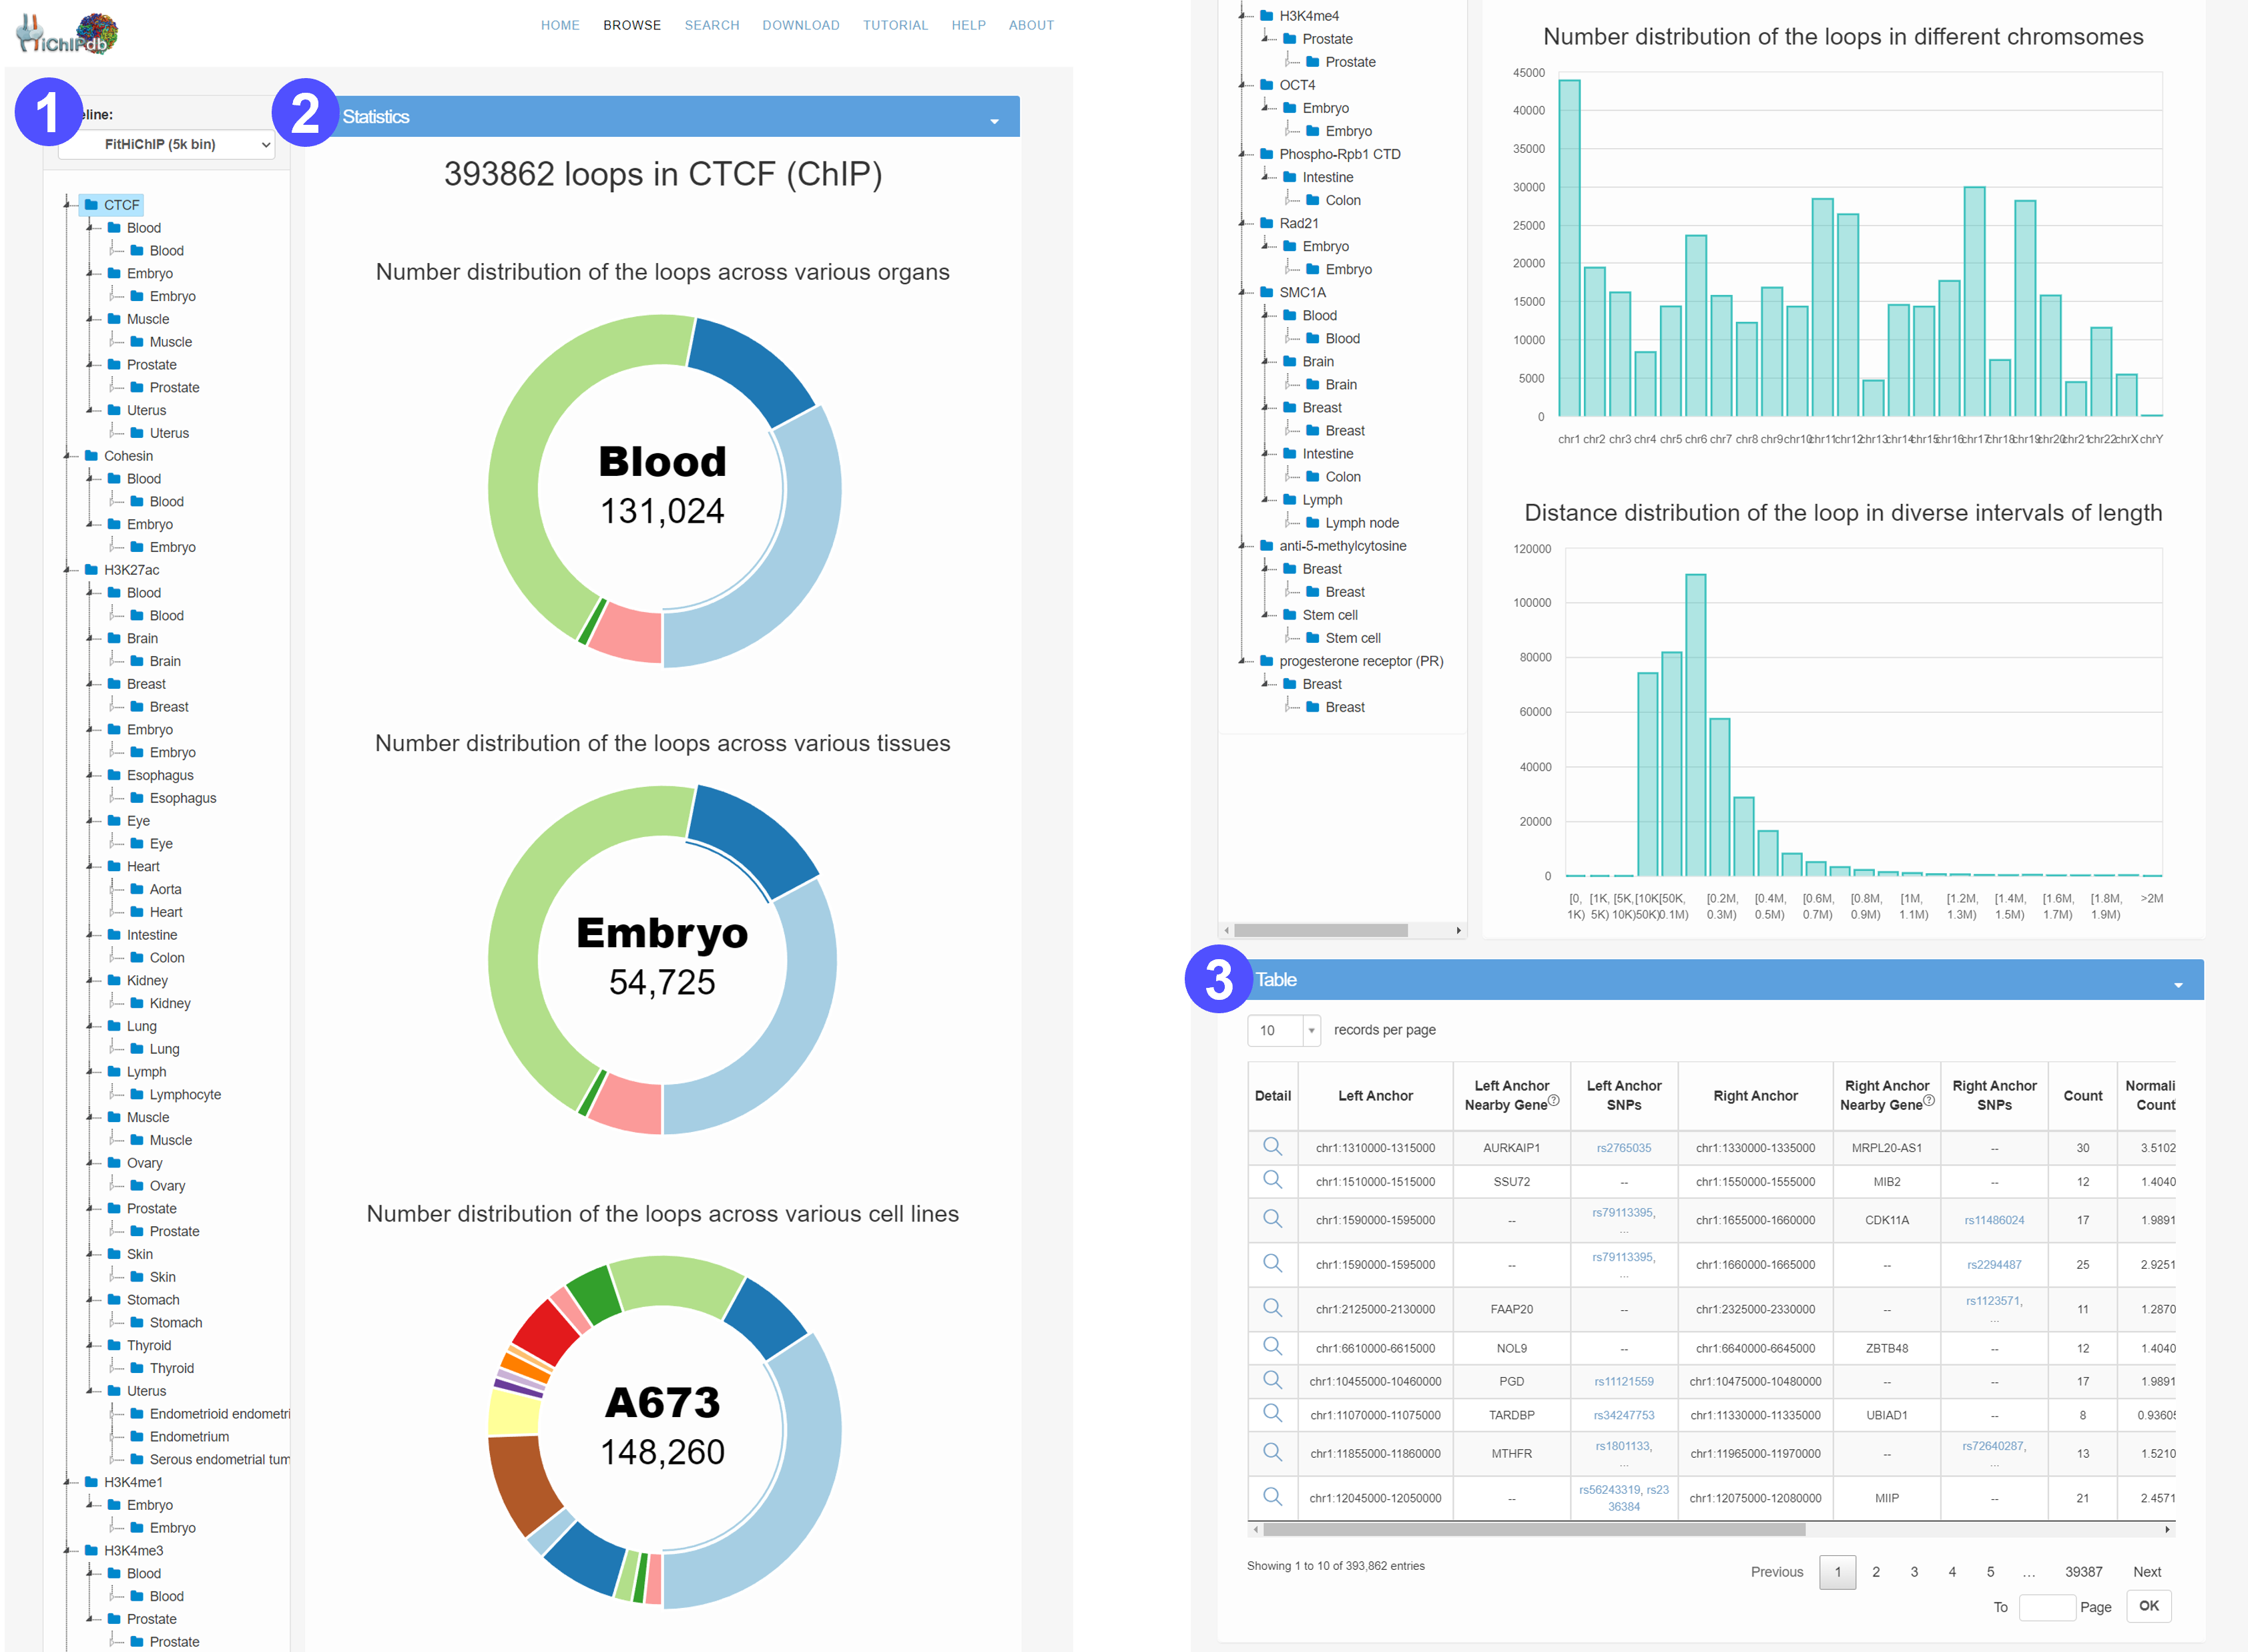
- Users can browse HiChIP loops of interest by selecting an organ, tissue, or cell type in the hierarchical tree.
- We provide comprehensive statistics and visualization with respect to the selected subset of HiChIP data.
- The number distribution of HiChIP across various organs, tissues and cell types.
- The number distribution of HiChIP across different chromosomes.
- The length distribution of HiChIP interacitons.
- The selected subset of HiChIP loops are displayed in an interactive table. Users can click the Detail tab to access detailed information about this HiChIP loop on a new page.
Search page
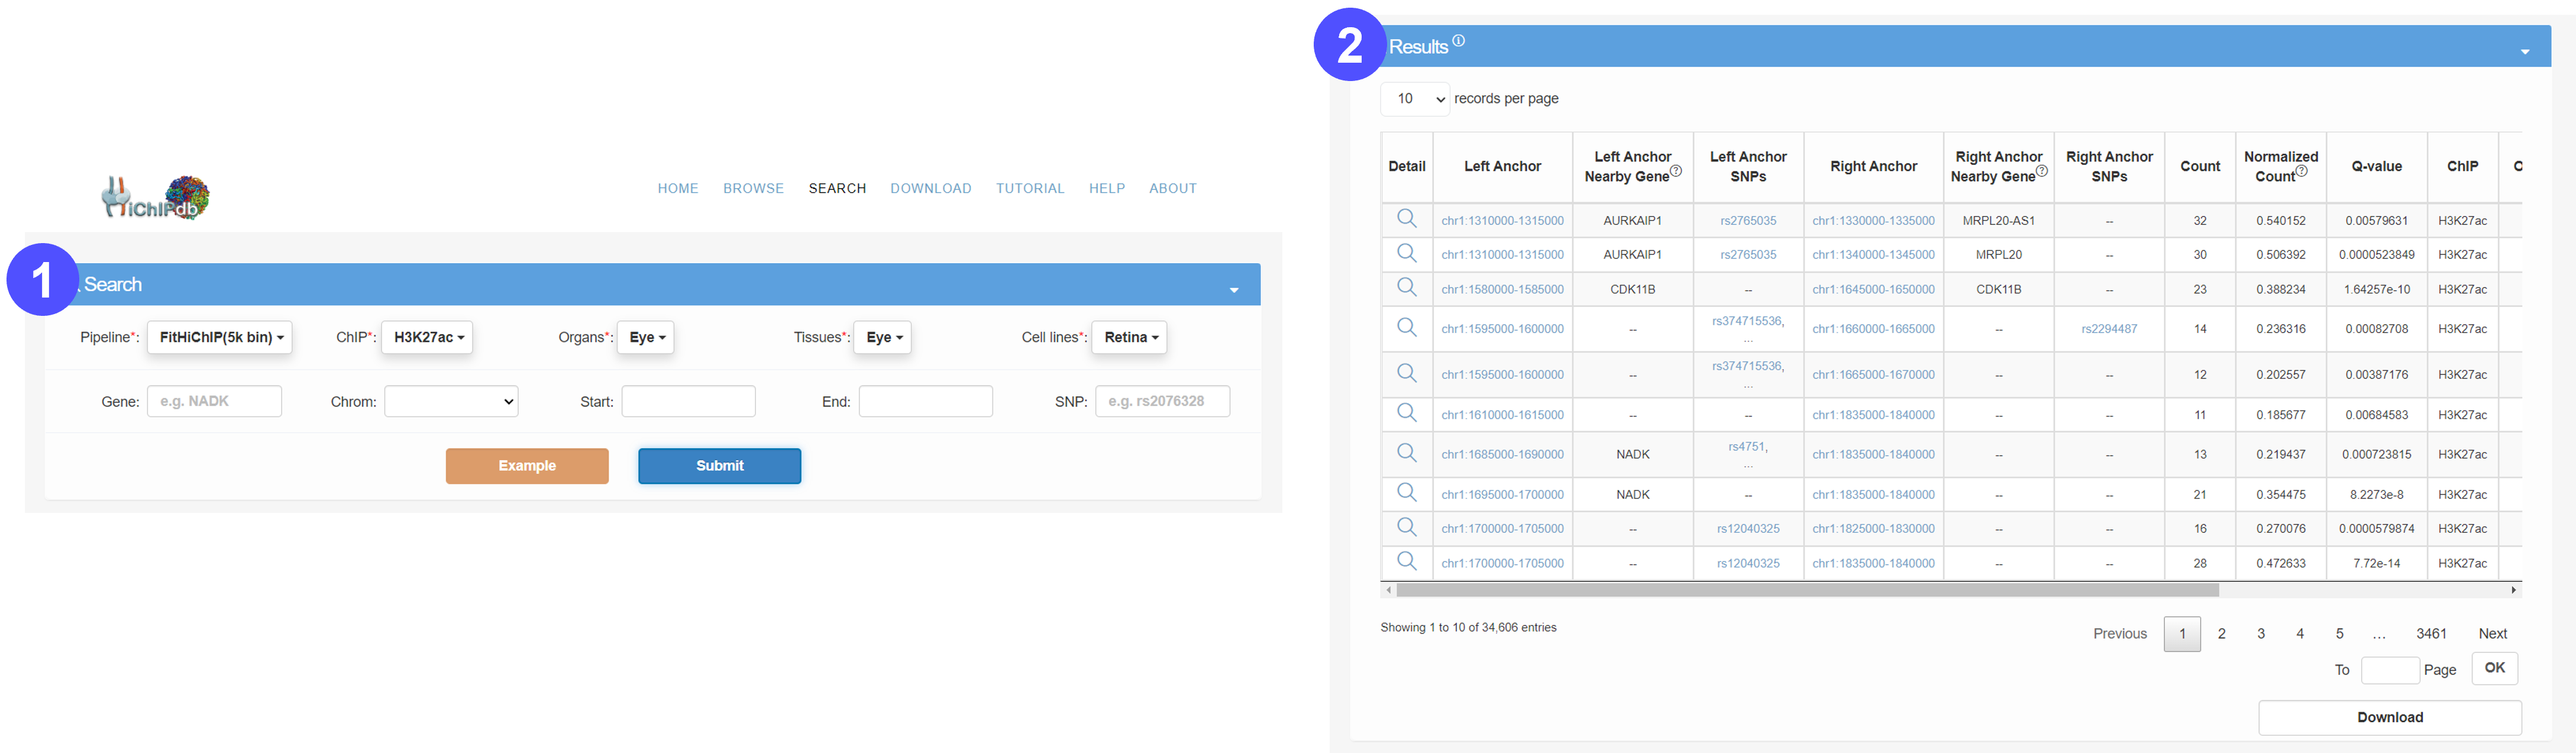
- Users should first determine the scope of the HiChIP loop query by determining the resolution of the processing pipeline. Users can then search for HiChIP loops of interest by selecting the particular organ, tissue and cell type from pull-down menus. Users can also narrow down the scope of the HiChIP loop query by specifying associated gene, genomic location and/or SNP ID. We also provide an example to facilitate searching.
- The results will be displayed in an interactive table.
- Users can click the Detail tab to access detailed information about this HiChIP loop on a new page.
- By clicking the Download button, users can download the search results in compressed format.
Details page
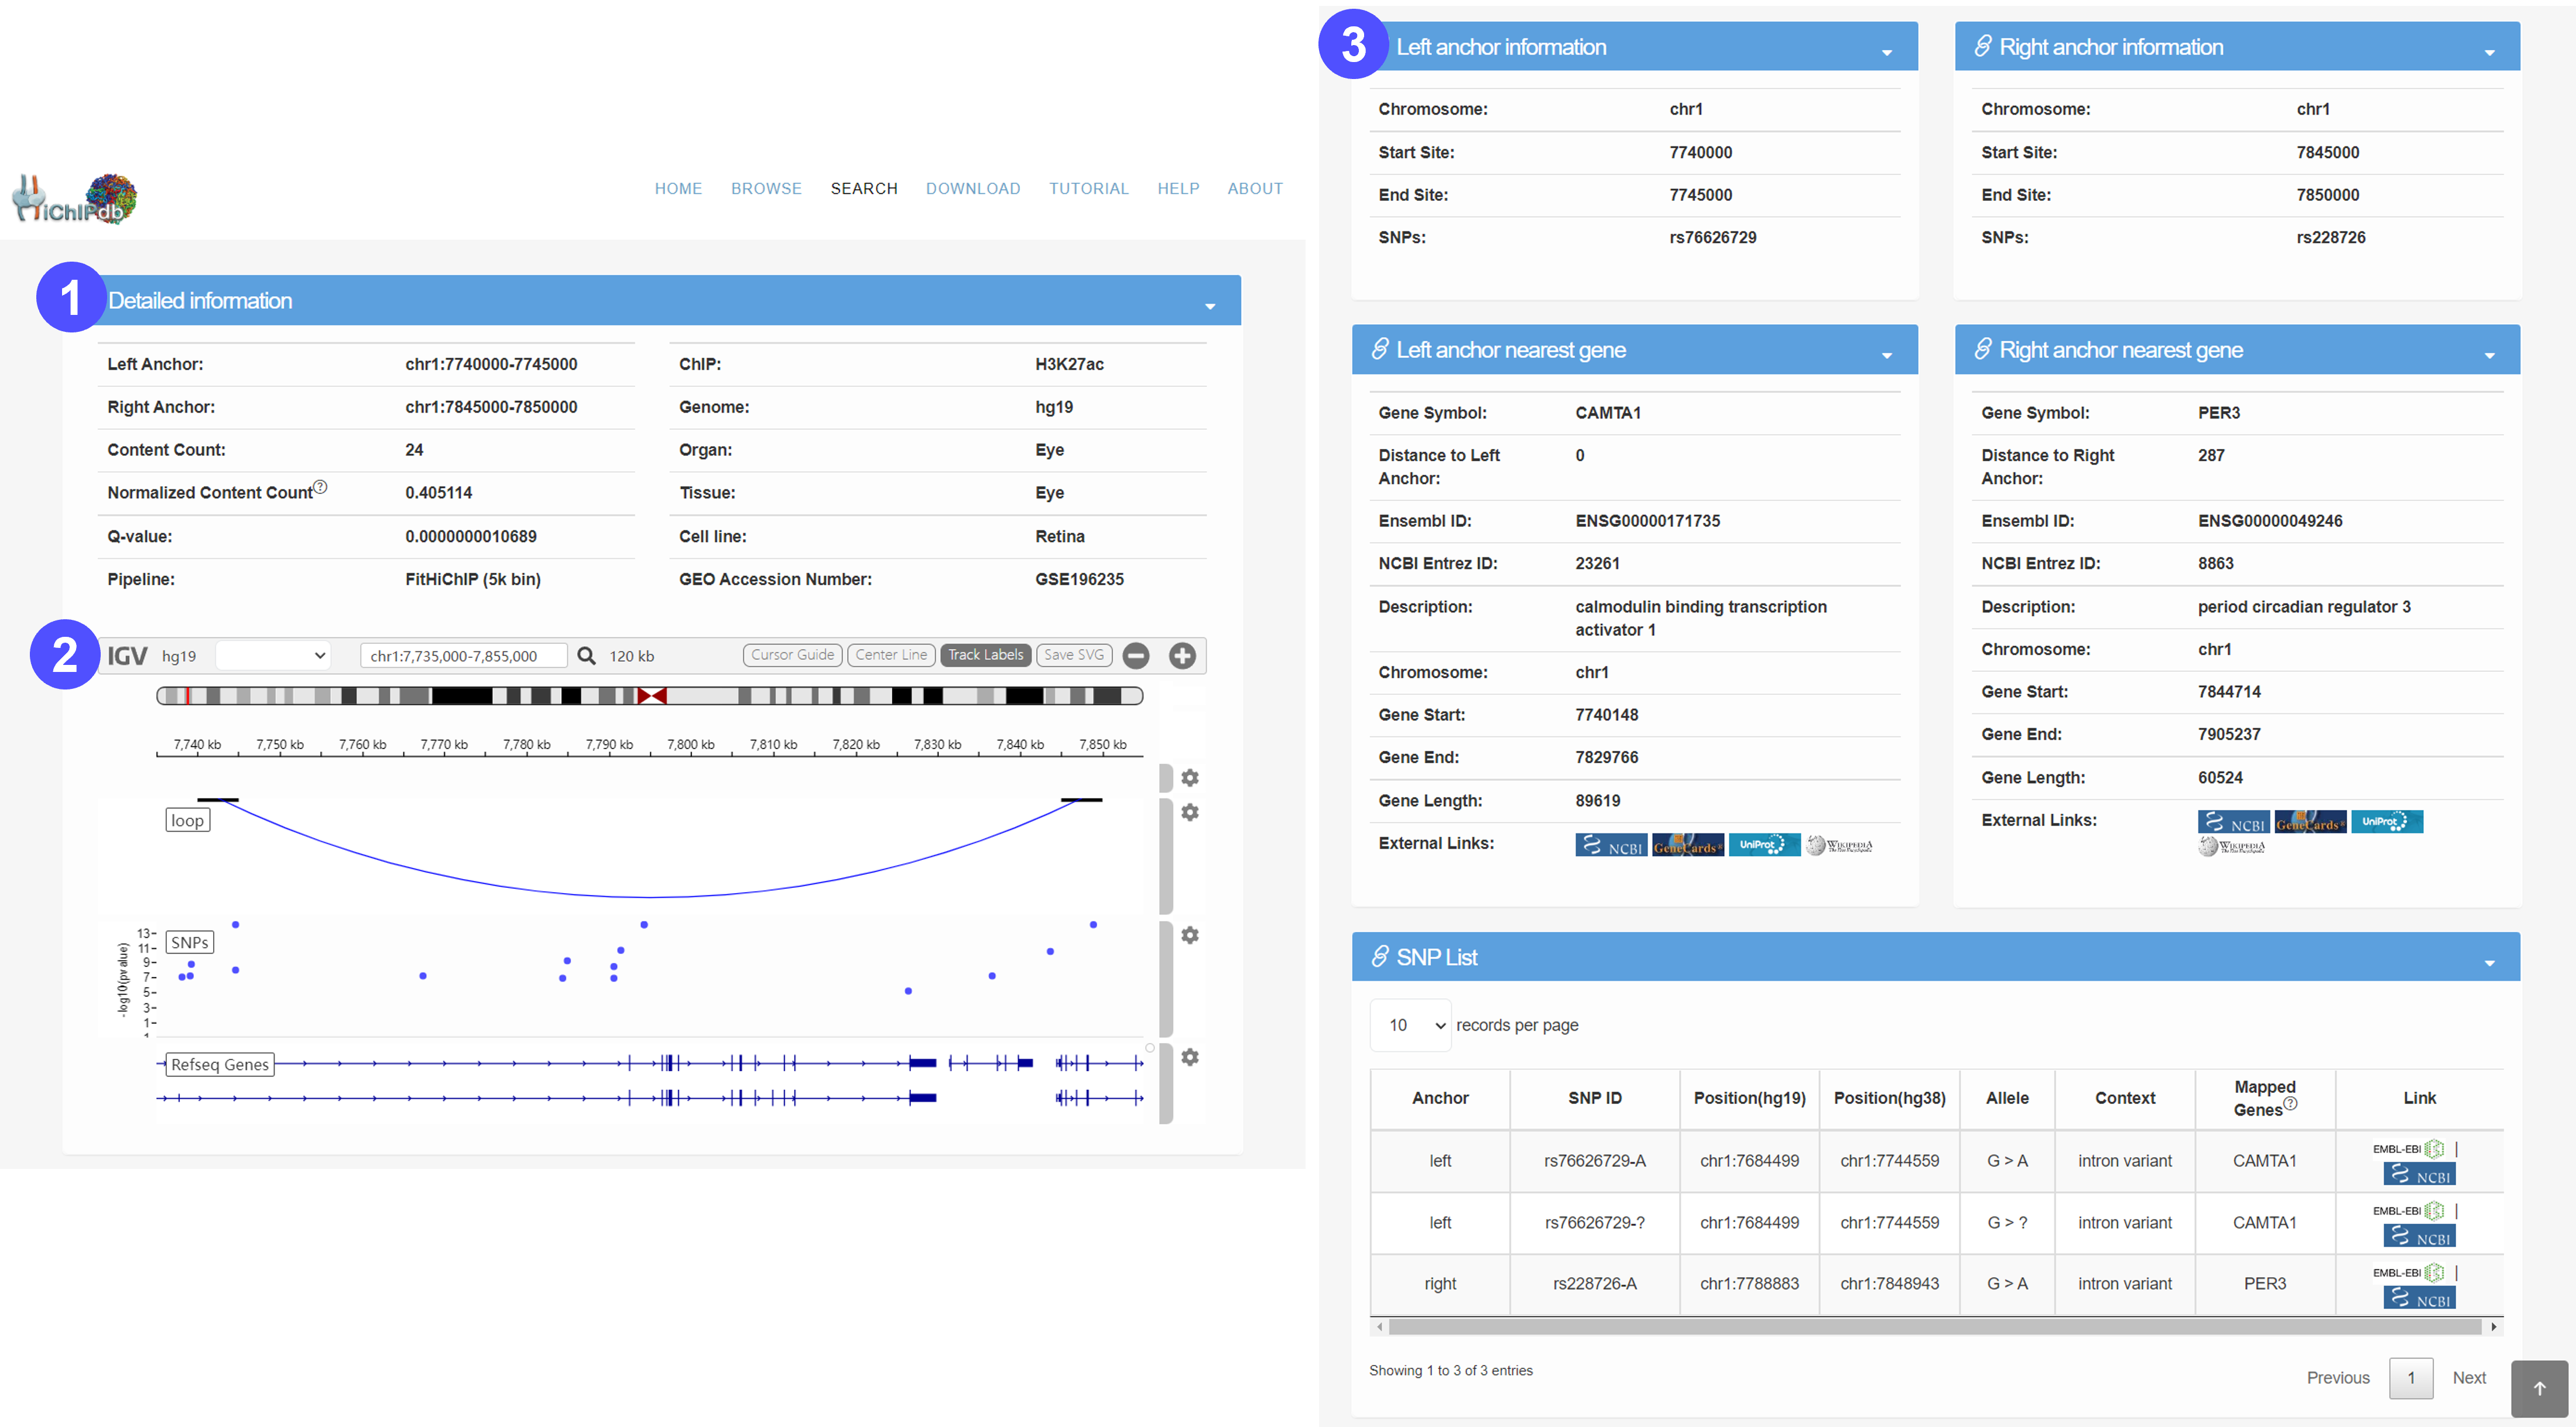
- Detailed information includes the location of left anchor and right anchor, categories (by species, organ, tissue, or cell type), loop count, normalized loop count, q-value, preprocess pipeline, ChIP type and GEO accession number.
- To help users view proximity information of HiCHIP in genomes, we developed a personalized genome browser using IGV with useful tracks, such as SNP annotation and Refseq Gene annotation. Users can interact with the visualization and export them in SVG formats.
- We provide overview information about the left anchor, left anchor overlapped gene, right anchor and the right anchor overlapped gene. Users can click on the icons to be redirected to external databases (GeneCards, UniProt and NCBI, etc.) for additional information.
- We also provide detailed SNP lists that are overlapped with the anchors. Users can click on the icons to view additional information at external databases (EBI and NCBI).
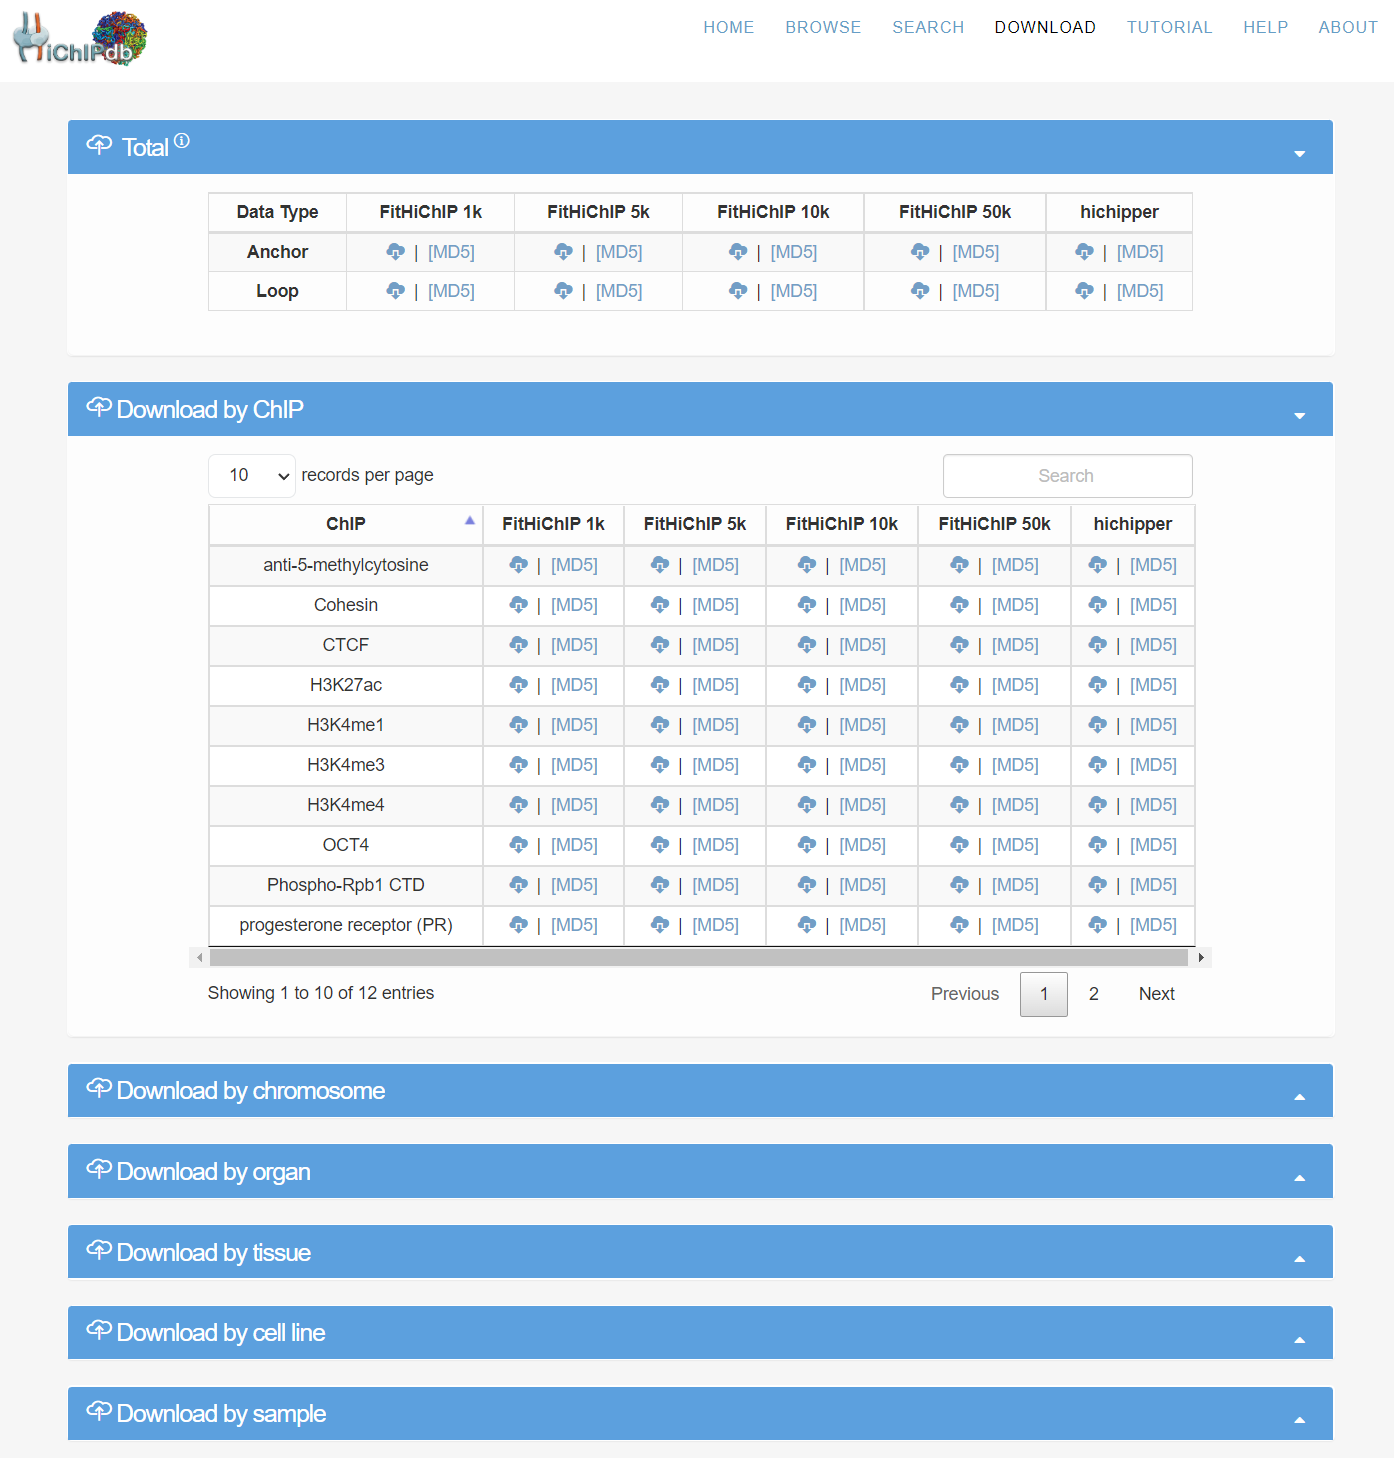
Download page
- We first provide all anchors and loops data to download. We categorize the HiChIP by ChIP type, chromosome, method, organ, tissue, cell type and sample to facilitate the data downloading. For each of the category, we provide FitHiChIP 1kb, 5kb, 10kb, 50kb and hichipper preprocessed results.
- The data can be downloaded in csv format. The corresponding MD5 files are provided to ensure the integrity of the downloaded data. We also provide advanced features such as searching and sorting for convenience.
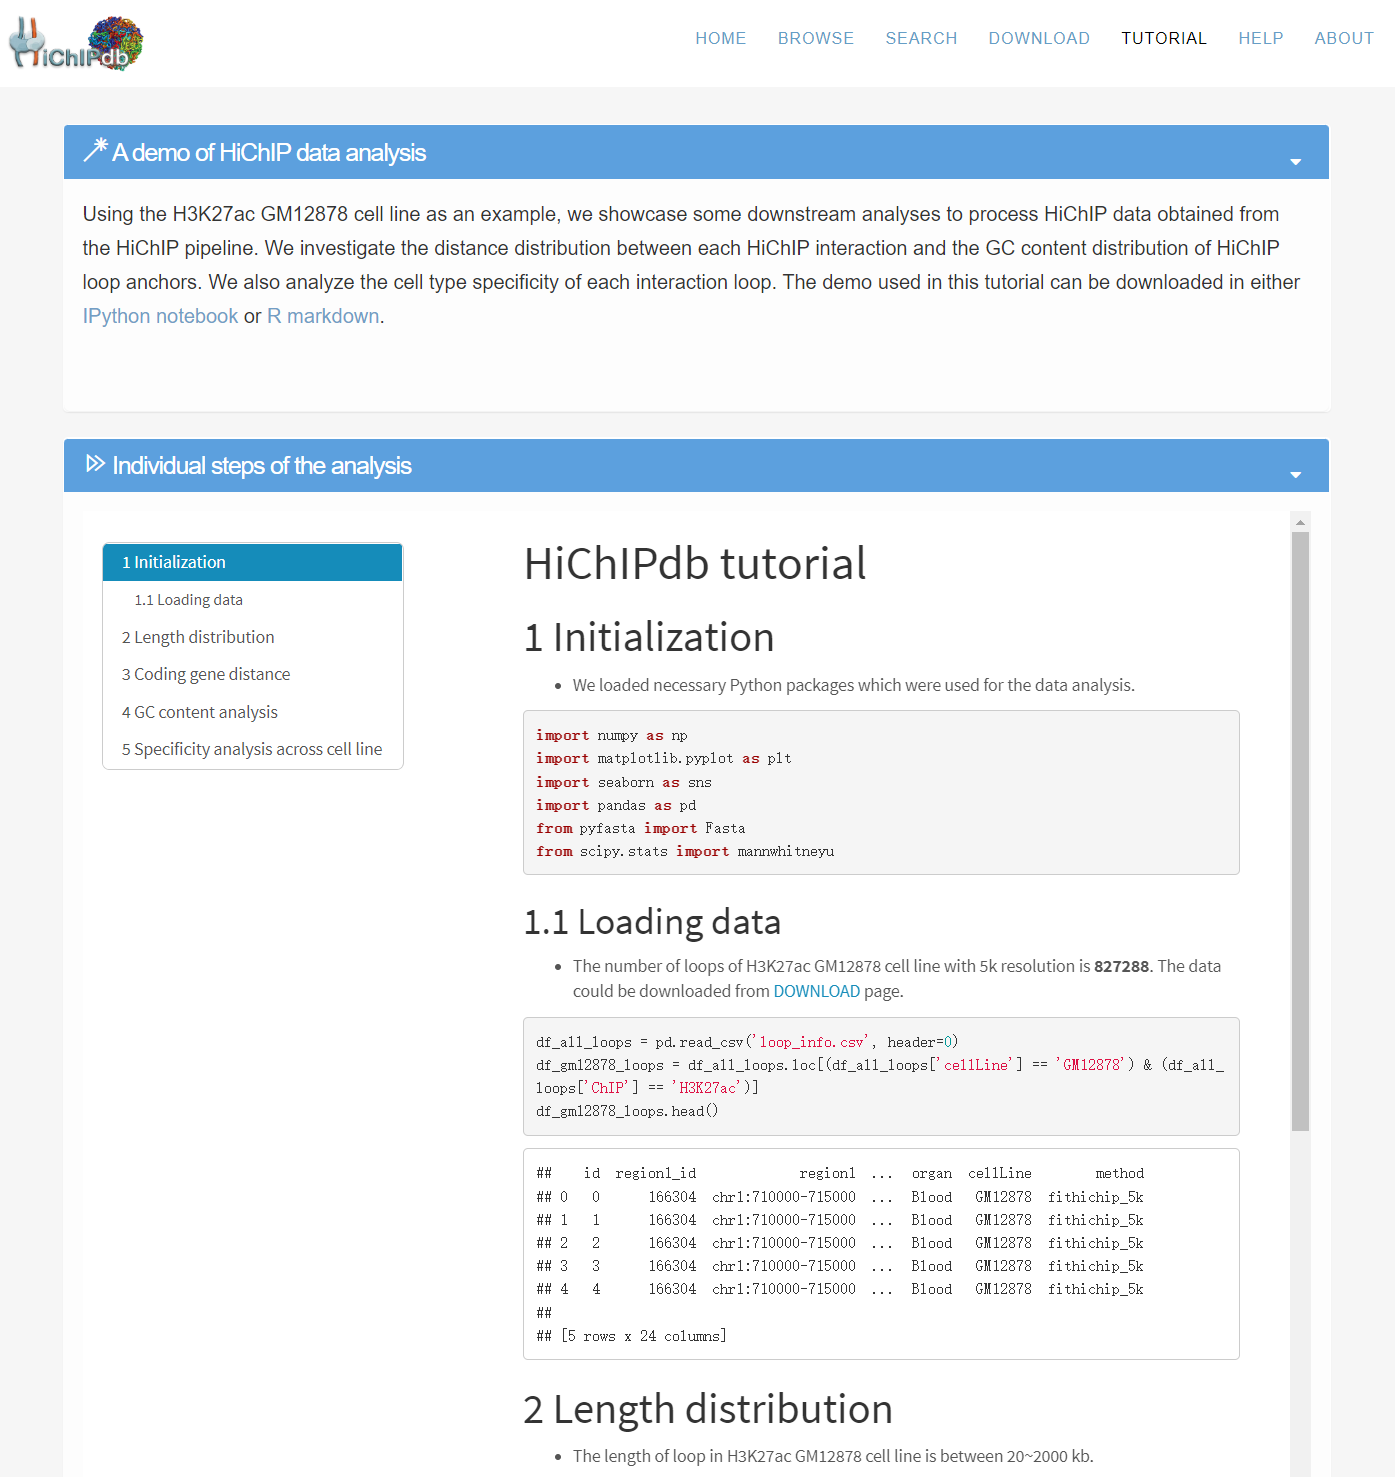
Tutorial page
- Using the HiChIP H3K27ac loops of the human GM12878 cell type, we provide a demo for the analysis of HiChIP data. We walk through the workflow for analyzing the distance distribution of loops, the GC content of loop anchors, and the cell type specificity of HiChIP loops.
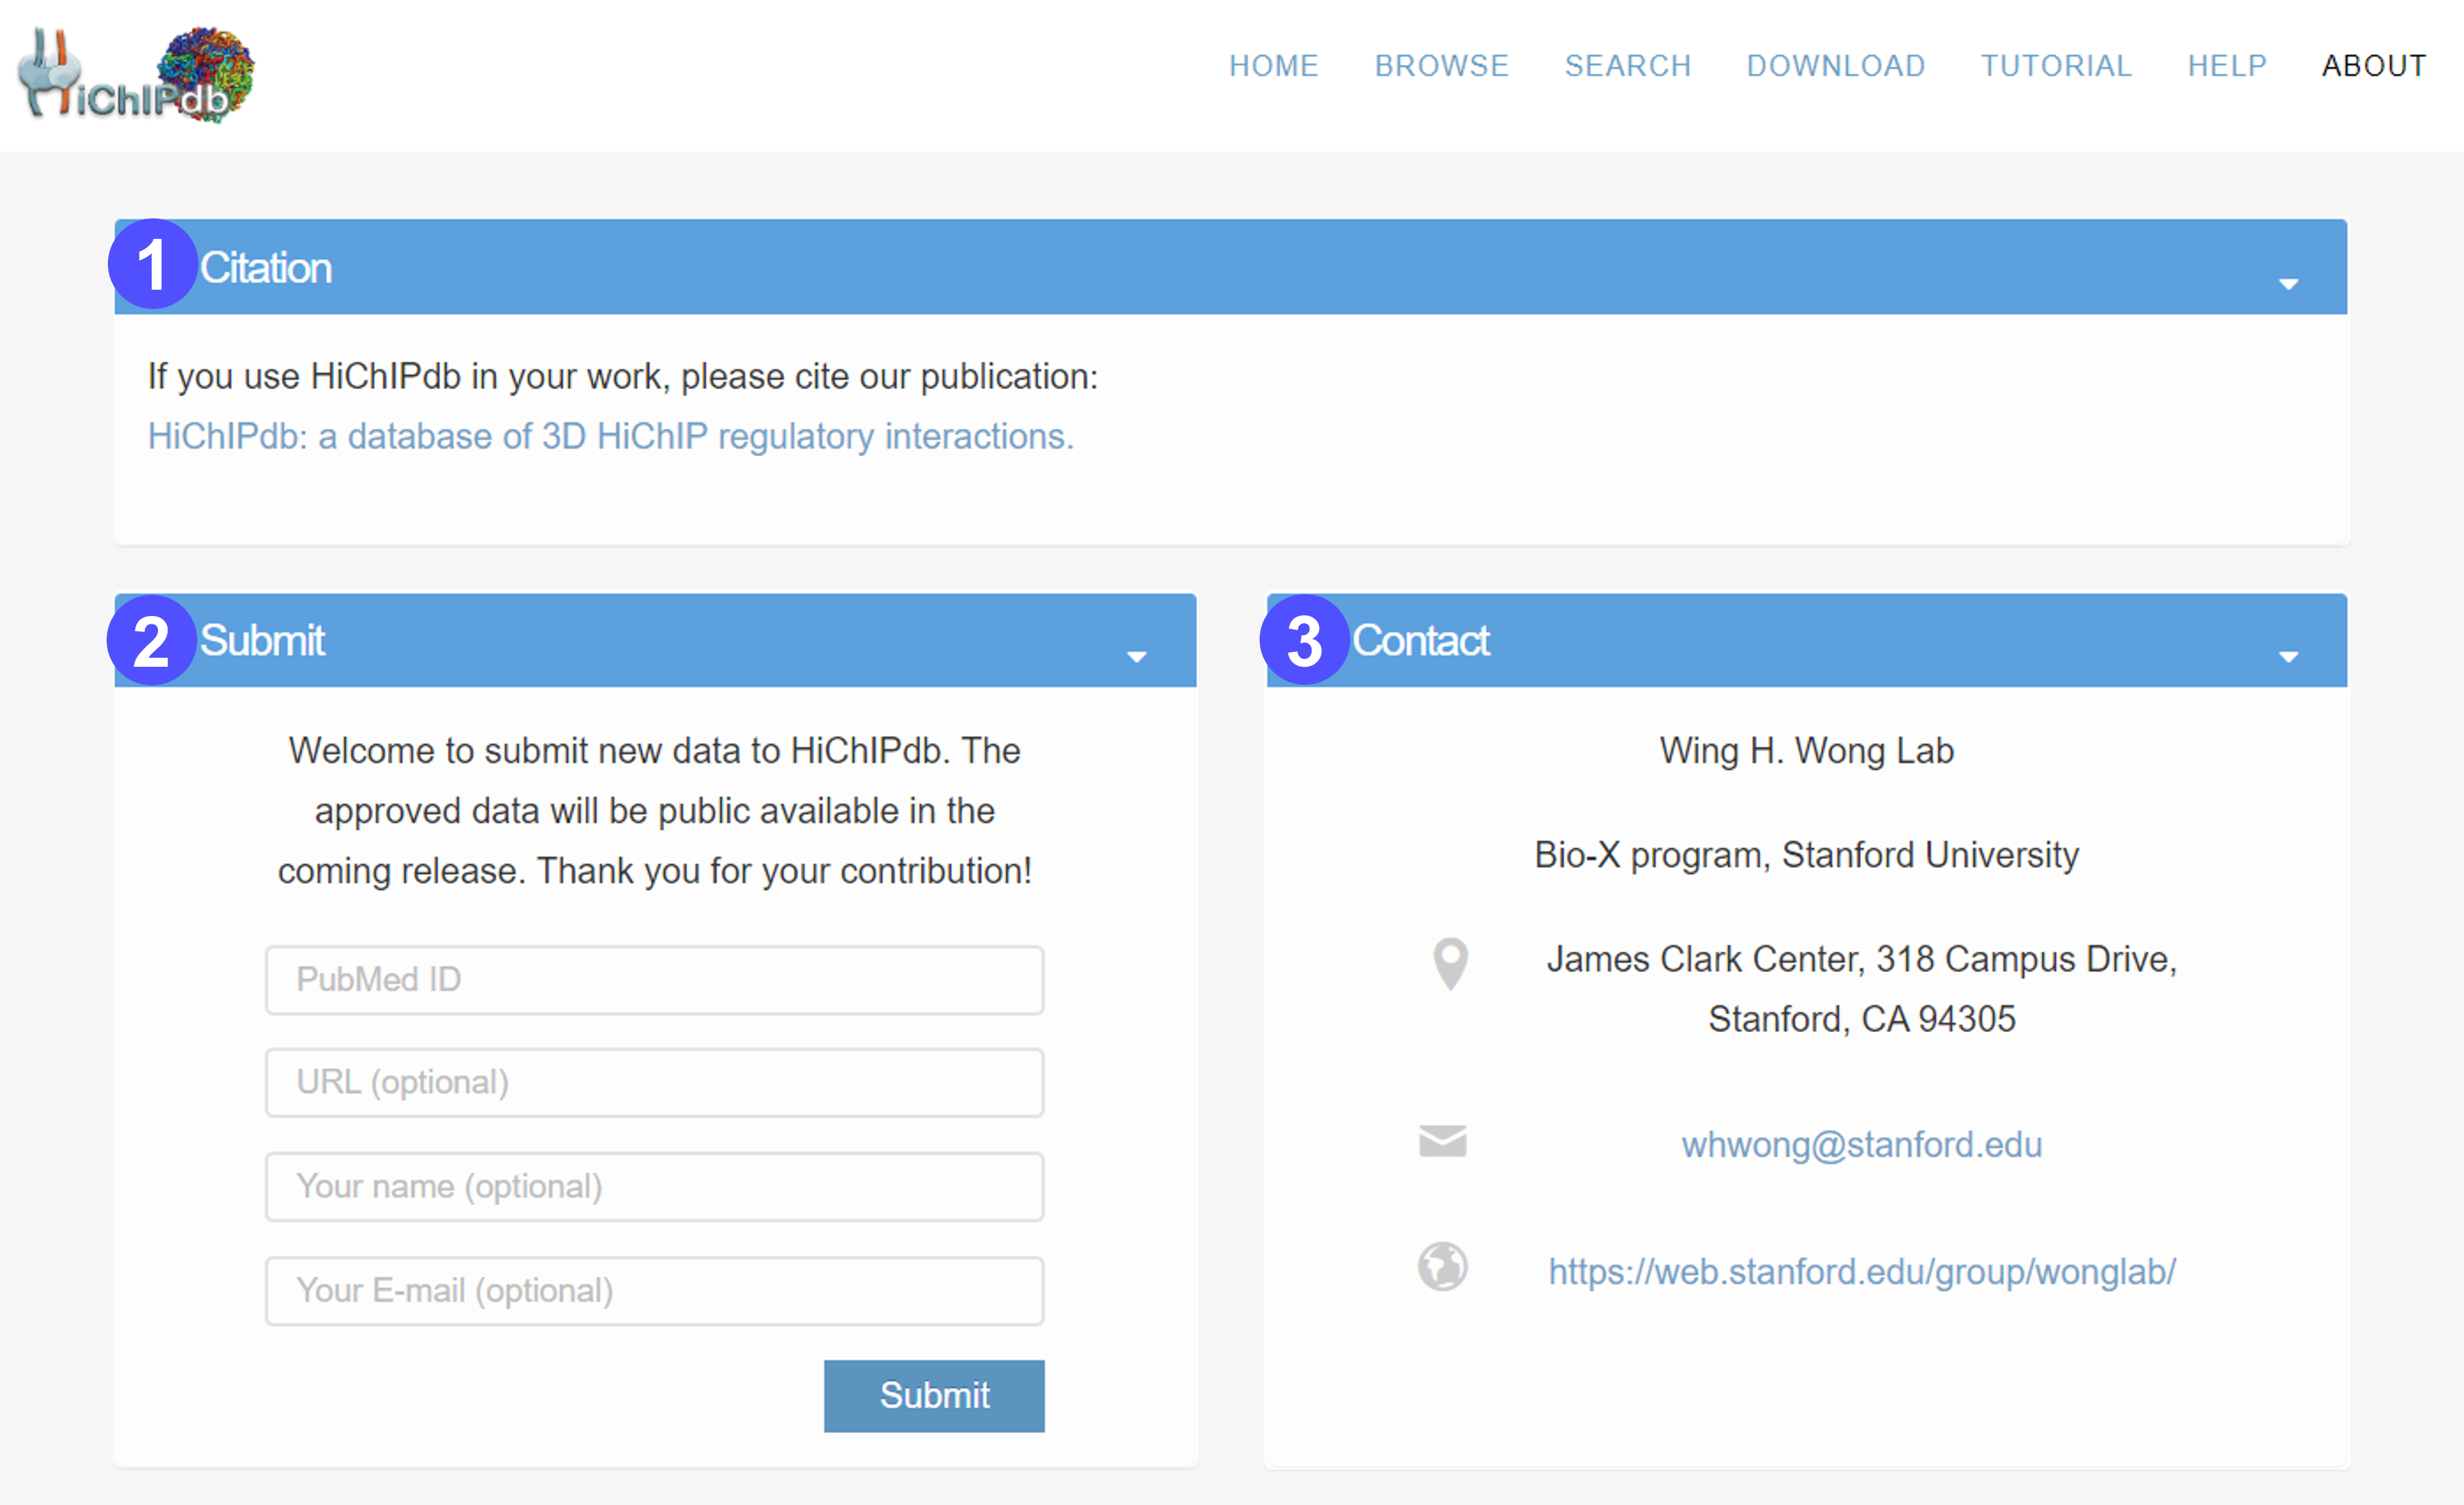
About page
- The citation information of HiChIPdb.
- The interface for submitting data to HiChIPdb. Users can submit their HiChIP data with the PubMed reference ID and optional information such as URL, name, and E-mail. The approved data will be public available in the coming release. We appreciate the users for their contribution.
- The contact information of HiChIPdb. Please feel free to contact us if you have any question about HiChIPdb.
The browser compatibility of HiChIPdb
| Operating System | Version | Chrome | Firefox | Opera | Microsoft Edge | Safari |
|---|---|---|---|---|---|---|
| Windows | Windows 10 Pro | |||||
| MacOS | Sierra 10.12 | Linux | Ubuntu 16.04 |
Frequently asked questions
What is HiChIPdb?
Overall, HiChIPdb presents a comprehensive compilation of published HiChIP samples with reliable annotations and interactive features for user-friendly visualization. In addition to its collection of informative data, HiChIPdb is developed to ultimately benefit prospective downstream applications. Before the development of this database, several studies have already started to leverage on protein-centric HiChIP data to computationally model genomic architecture and we have been actively contributing to this area of research in the past few years. For example, DC3 deconvolutes bulk HiChIP into subpopulation-specific profiles to enhance clustering performance of the single-cell data (Zeng et al., Nat. Commun., 2019); DeepExpression adopts HiChIP as input features to predict gene expression (Zeng et al., Bioinformatics, 2020); Both the modified DeepExpression and vPECA integrate HiChIP with public genomic data to interpret genetic variants (Zeng et al., Nat. Mach. Intell., 2021). Nonetheless, systematic efforts to fully exploit HiChIP data across numerous samples still remain largely elusive. HiChIPdb aims to address this challenge and offers a promising avenue for researchers to investigate genome-wide chromatin interactions across different cell types in the context of various proteins of interest. Many advantages of HiChIPdb, such as stringent preprocessing pipeline with multiple resolution options, extensive annotations of epigenomic profile and GWAS catalog, are designed to facilitate integrative analysis and/or modeling of various properties of 3D chromatin structure. We anticipate this database has the potential to empower future computational approaches and deepen our understanding of gene regulatory networks and disease mechanism.
What features HiChIPdb?
In total, HiChIPdb currently contains 200 high-throughput HiChIP samples across 108 cell types. Under 5 kb resolution, 21,422,946 loops spanning 496,763 anchors were observed among all samples. All HiChIP samples are preprocessed using a unified framework including FastQC basic read quality check, HiC-Pro alignment, quality control and replicate merge. Due to the low read-pair density in HiChIP data, multiple resolution at 1/5/10/50 Kb are offered through computational tool FitHiChIP (Bhattacharyya et al., Nat. Commun., 2019) and variable length through hichipper (Caleb A Lareau et al., Nature methods, 2018). Each HiChIP sample in HiChIPdb is labeled with extensive details such as cell type, tissue, organ, etc. Various statistical measures including the length distribution of HiChIP anchors, the length distribution of HiChIP loops and the density distribution of HiChIP interactions in different chromosomes are provided on the Browse page for cross-referencing. Unlike Hi-C and other conventional chromatin conformation strategies, HiChIP signals indicate protein-centric in situ chromatin loops that carry significant functional implications. Hence, in addition to the above-mentioned visualization tools, HiChIPdb places strong emphasis on functional annotations of regulatory genes and GWAS catalog SNPs overlapping with HiChIP anchors. Annotated genes are listed on the Detail page of respective interactions with appropriate links to external databases (e.g., GeneCards, UniProt and NCBI, etc.). Similarly, annotated SNPs are linked to dbSNP. Other functionalities in HiChIPdb include advanced searching, hierarchical browsing, interactive visualization with custom tracks and data downloading in different formats. A detailed preprocessing and statistical analysis of a HiChIP sample is presented as an exemplary usage of the database on the Analysis page.
Why is it slow to load HiChIPdb for the first time?
The first time the browser opens HiChIPdb, it needs to load some web plug-ins for advanced visualization and table features, resulting in the slow loading. We have been working on optimizing the experience of using HiChIPdb.
Do you have any example for demonstrating the importance of HiChIP interactions?
The accurate identification of HiChIP interactions has the potential to give insights to a more complete interpretation of GWAS risk variants and aid in developing disease therapy method. For example, Mumbach et al. takes advantage of this principle to chart the connectivity of autoimmune and cardiovascular disease genome-wide association study (GWAS)-identified SNPs and link SNPs to hundreds of potential target genes. Although non-genic SNPs have previously been paired with their closest neighboring gene, they find that the majority of these variants can engage in long-distance interactions, including skipping several promoters to predicted target genes, connecting to multiple genes, or acting in concert with enhancer cliques to contact a single gene. Further use of this approach will help to clarify hidden mechanisms of human disease that are driven by genetic perturbations in non-protein-coding DNA elements, which can now be linked to their cognate gene targets in primary cells.
What's the format of the downloaded file?
The loop file is in csv format, and the meaning of each column is described below.
| Column | Description |
|---|---|
| anchor1ID, anchor2ID | the ID of anchors in HiChipDB database. |
| anchor1, anchor2 | the chromosome position of anchors. |
| anchor1Symbol, anchor2Symbol | the nearly genes (genes with TSS within 1k bp from the anchors). |
| anchor1Snp, anchor2Snp | the mapped SNPs on the anchor. |
| anchor1SnpAllele, anchor2SnpAllele | the mapped SNPs with risk allele on the anchor. |
| count | the content count of the loop. |
| normCount | the normalized content count, i.e. the content count normalized by the total content counts of this sample and multiplied by a scale factor, i.e., 10,000. |
| qValue | the Q-value of the loop. |
| geoID | the GEO Accession Number of the sample. |
| sampleID | the treatment condition of the sample. |
| ChIP | the ChIP-seq type of the sample. |
| tissue | the tissue of the sample. |
| organ | the oragan of the sample. |
| cellLine | the cell type of the sample. |
| pipeline | the calclution pipeline, i.e.FitHiChIP(1k bin), FitHiChIP(5k bin), FitHiChIP(10k bin), FitHiChIP(50k bin) and hichipper. |
The anchor annotation file is also in csv format. Anchor are annotated by ChiPseeker
(Guangchuang et al.,Bioinformatics). SNPs database is downloaded from EMBL-EBI. The meaning of each column of annotation file is described below.
| Column | Description |
|---|---|
| id | the ID of anchor in HiChipDB database. |
| anchor | the chromosome position of anchor. |
| annotation | the genomic annotation of the anchor by ChiPseeker. |
| symbol | the gene symbol of the nearly genes (genes with TSS within 1k bp from the anchors). |
| ensembl | the gene ensembl ID of the nearly genes (genes with TSS within 1k bp from the anchors). |
| entrezID | the gene entrez ID of the nearly genes (genes with TSS within 1k bp from the anchors). |
| description | the gene description of the nearly genes (genes with TSS within 1k bp from the anchors). |
| geneDistance | the distance of annotated gene to the anchor. 0 indicates the anchor is on the gene region. |
| geneChr | the chromosome of annotated gene to the anchor. |
| geneStart | the start site of annotated gene to the anchor. |
| geneEnd | the end stie of annotated gene to the anchor. |
| geneLength | the length of annotated gene to the anchor. |
| geneStrand | the strand of annotated gene to the anchor. |
| snp | the snp variant ID that on the anchor. If more than one SNP are on the anchor, they are seperated by comma. |
| snpAllele | the snp variant ID with risk allele that on the anchor.If more than one SNP are on the anchor, they are seperated by comma. |
| snpChrom | the chromsome of the annotated SNPs.If more than one SNP are on the anchor, they are seperated by comma. |
| snpPosition | the genomic position of the annotated SNPs.If more than one SNP are on the anchor, they are seperated by comma. |