A demo for the analysis of silencers
Since efforts to systematically characterize silencers have been limited, we walk through the following analysis to gain a preliminary understanding of silencers. Using the silencers validated in the human K562 cell line as example, we investigate the length distribution of silencers, the distance between silencers and the nearest genes, the GC content of silencers, and the cell line specificity of silencers. All the data used in this demo can be downloaded from here.
- The number of silencers validated in the human K562 cell line is 6924.
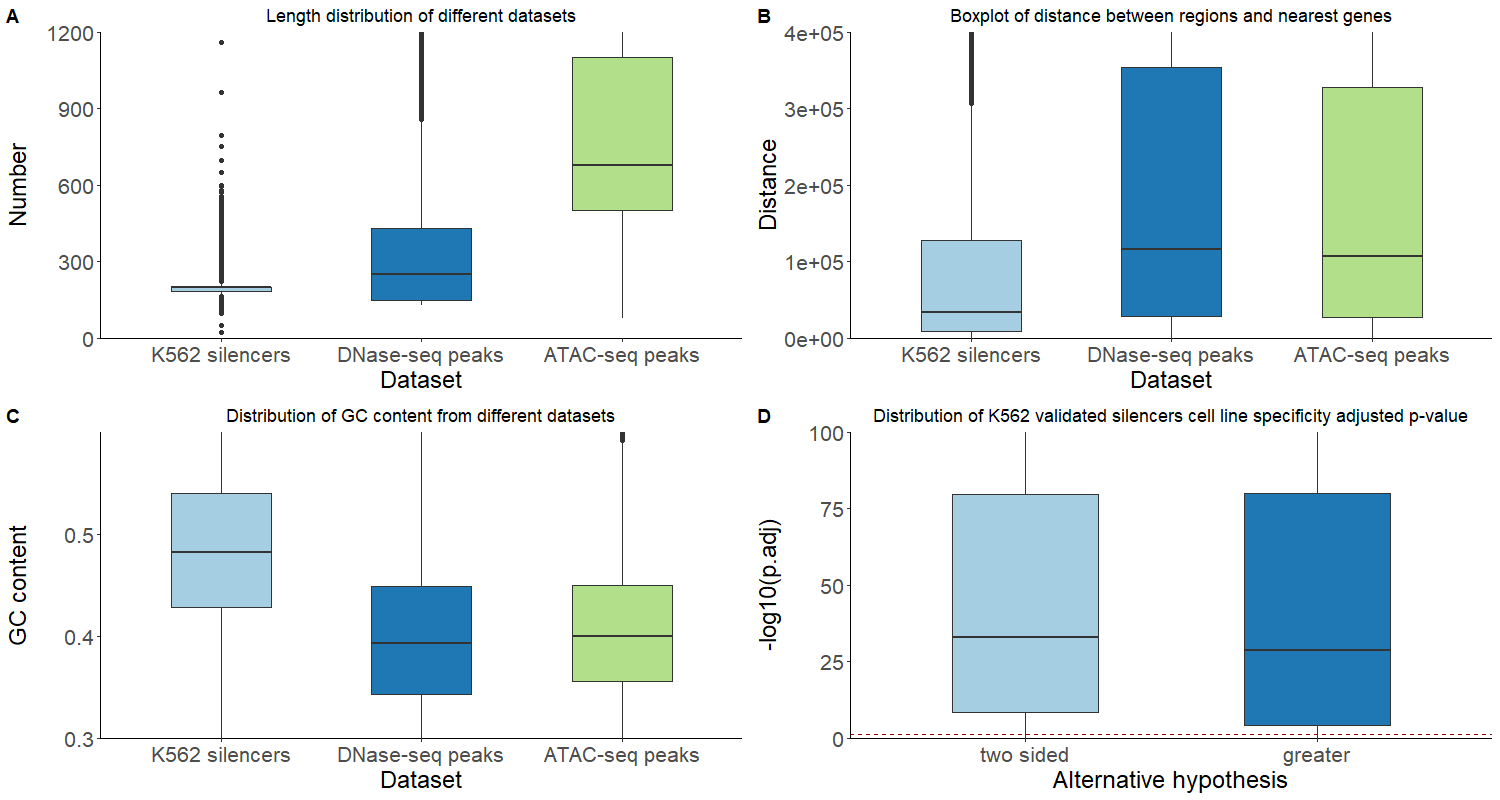
- The length of silencers validated in the human K562 cell line is mainly between 100~300bp.
- The distance between silencers and the nearest genes.
- The average distance from the nearest coding gene to a silencer is 61721bp.
- The average distance from the nearest coding gene to a silencer is significantly less than that to a DNase-seq peak (144767bp, one-sided Wilcox test p-value=1.94e-165).
- The average distance from the nearest coding gene to a silencer is significantly less than that to a ATAC-seq peak (132892bp, one-sided Wilcox test p-value=2.06e-129).
- The GC content of silencers.
- The average GC content of a silencer is 0.4896.
- The average GC content of a silencer is higher than that of a DNase-seq peak (0.4266, one-sided Wilcox test p-value<2.2e-16).
- The average GC content of a silencer is higher than that of a DNase-seq peak (0.4222, one-sided Wilcox test p-value<2.2e-16).
- The cell line specificity of silencers.
- The ratio that openness of K562 cell line is significantly different from other cell lines, 188/198, is significantly higher than 0.5 by binomial exact test, p-value=5.32e-44.
- The ratio that openness of K562 cell line is significantly higher than other cell lines, 163/198, is significantly higher than 0.5 by binomial exact test, p-value=3.02e-21.