The documentation of SilencerDB
Home page
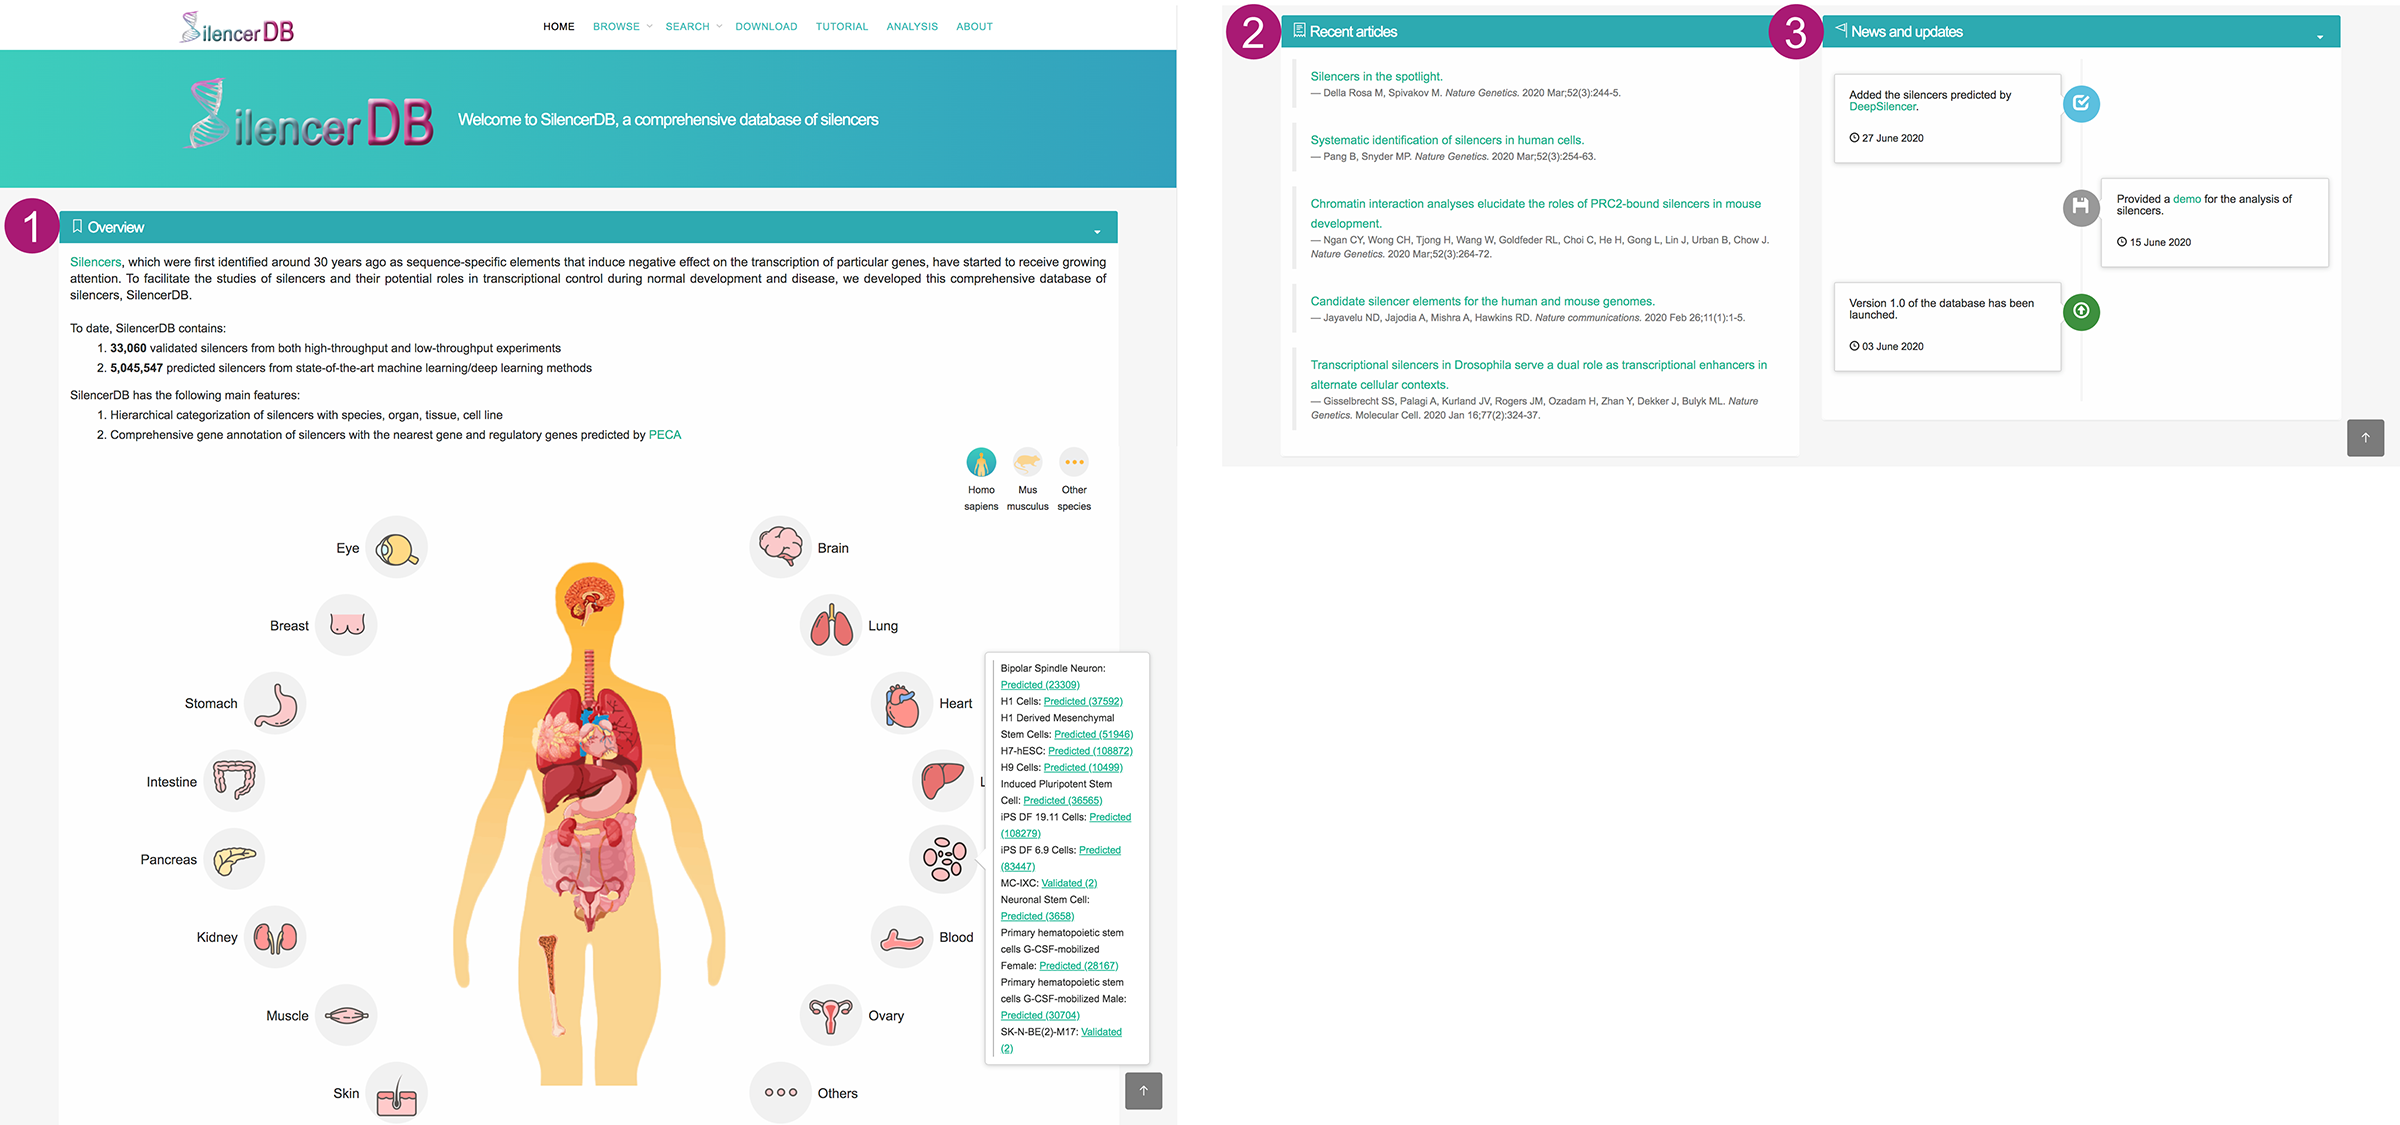
- A simple introduction about the database, with a global view of body maps of human and mouse.
- The body maps facilitate the quick browse of silencers across various organs and cell lines. Users can switch the body map by clicking the icon at the top right.
- The number of silencers in different cell lines can be accessed by clicking the organ icons.
- After choosing validated or predicted silencers of a specific cell line, it will jump to the corresponding Browse page to show more details.
- Recent articles about silencers.
- News and updates of SilencerDB.
Browse page
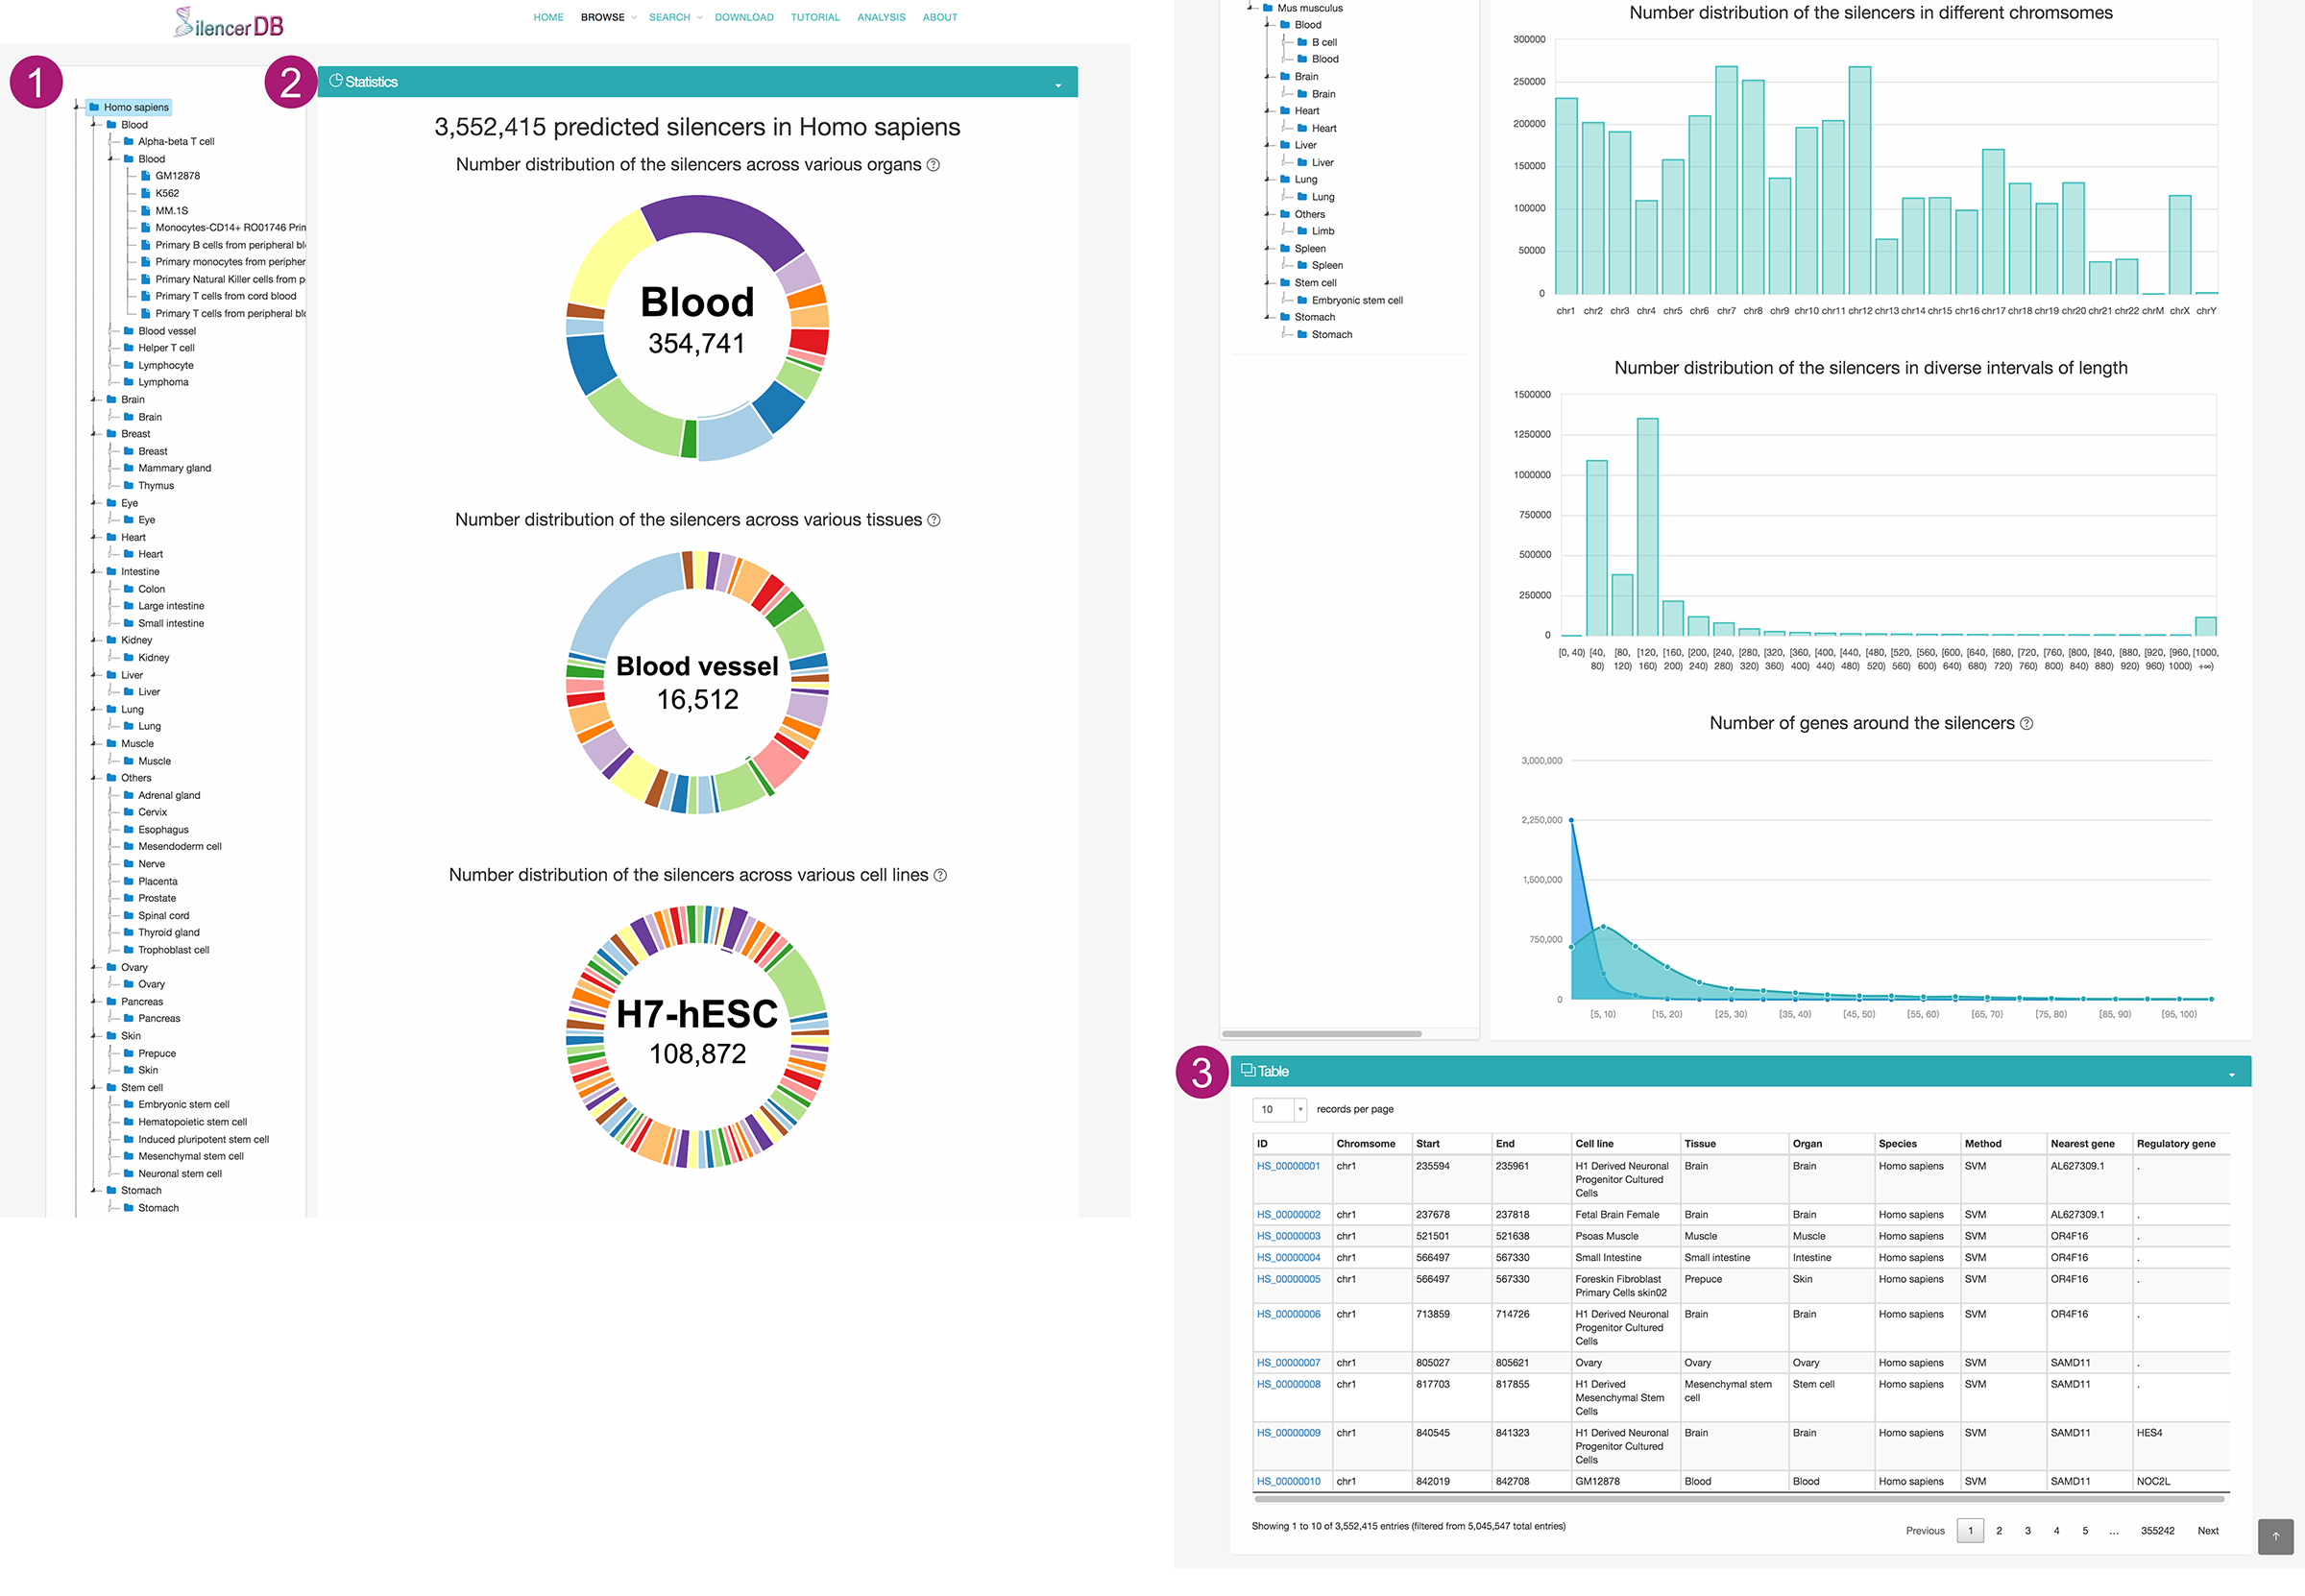
- Users can browse silencers of interest by selecting a species, organ, tissue, or cell line in the hierarchical tree.
- We provide comprehensive statistics and visualization with respect to the selected subset of silencers.
- The number distribution of silencers across various organs, tissues and cell lines
- The number distribution of silencers in different chromosomes.
- The length distribution of silencers.
- The number distribution of silencers in diverse intervals of neighboring (100K or 1M base-pairs upstream and downstream of the silencer) gene counts.
- The selected subset of silencers are displayed on a interactive table. Users can click the Silencer ID to access detailed information about this silencer on a new page.
Search page
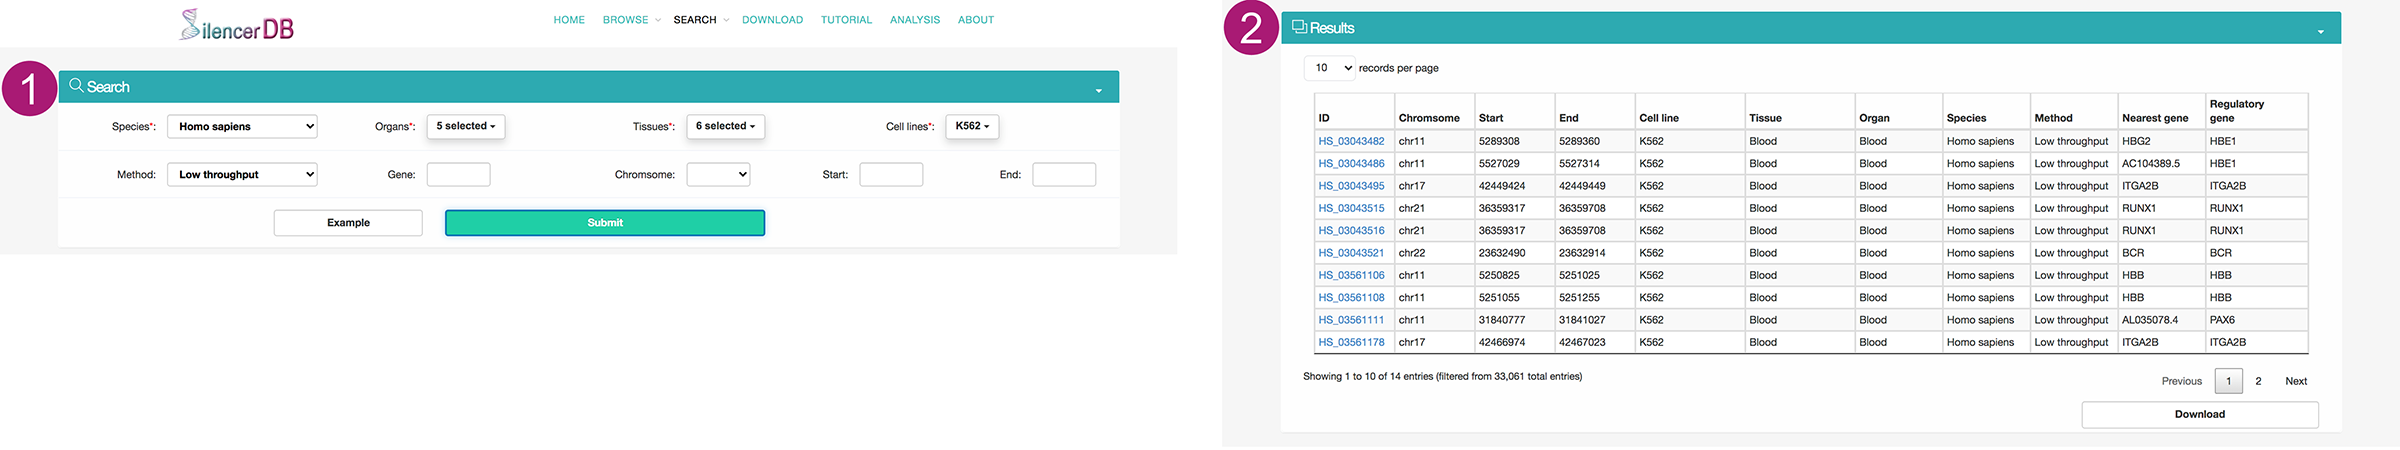
- Users can search for silencers of interest by selecting a species from the pull-down menu, and then selecting multiple organs, tissues and cell lines from the pull-down menu with advanced features such as searching and selecting-all. Users can also determine the scope of the silencer query by determining annotation method, associated gene, and genomic location for the results of interest. We also provide an example to facilitate the usage of searching.
- The results will be displayed on an interactive table.
- Users can click the Silencer ID to access detailed information about this silencer on a new page.
- By clicking the Download button, users can obtain the compressed results.
Details page
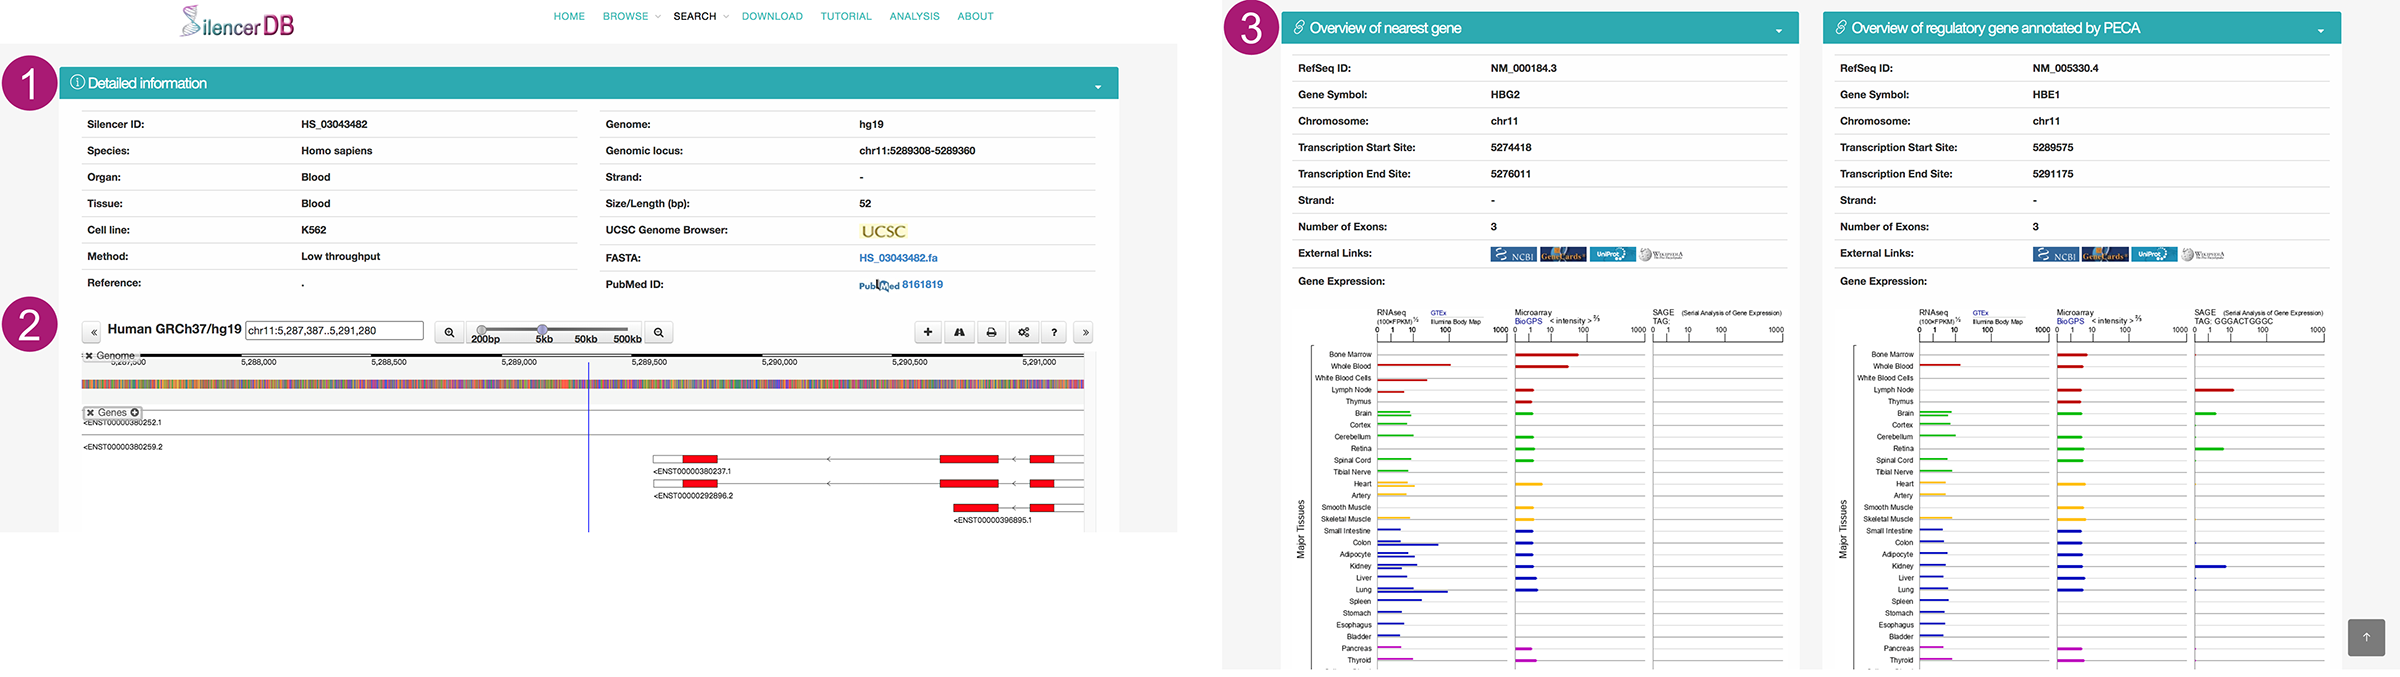
- Detailed information includes Silencer ID, categories (by species, organ, tissue, or cell line), annotation method, reference of source and corresponding PubMed ID, genomic location, size, external link to UCSC, and FASTA file.
- To help users view proximity information of silencers in genomes, we developed a personalized genome browser using Dalliance with useful tracks. Users can add other genomic annotation, configure tracks and options, export results, and get support using the top right buttons.
- We also provide overview information about the nearest gene and the potential regulatory gene. We annotate the nearest gene according to the genomic location, and the potential regulatory gene by the PECA model. Users can click on the icons to external databases (GeneCards, UniProt and NCBI, etc.). The gene expression in different tissues is also displayed.
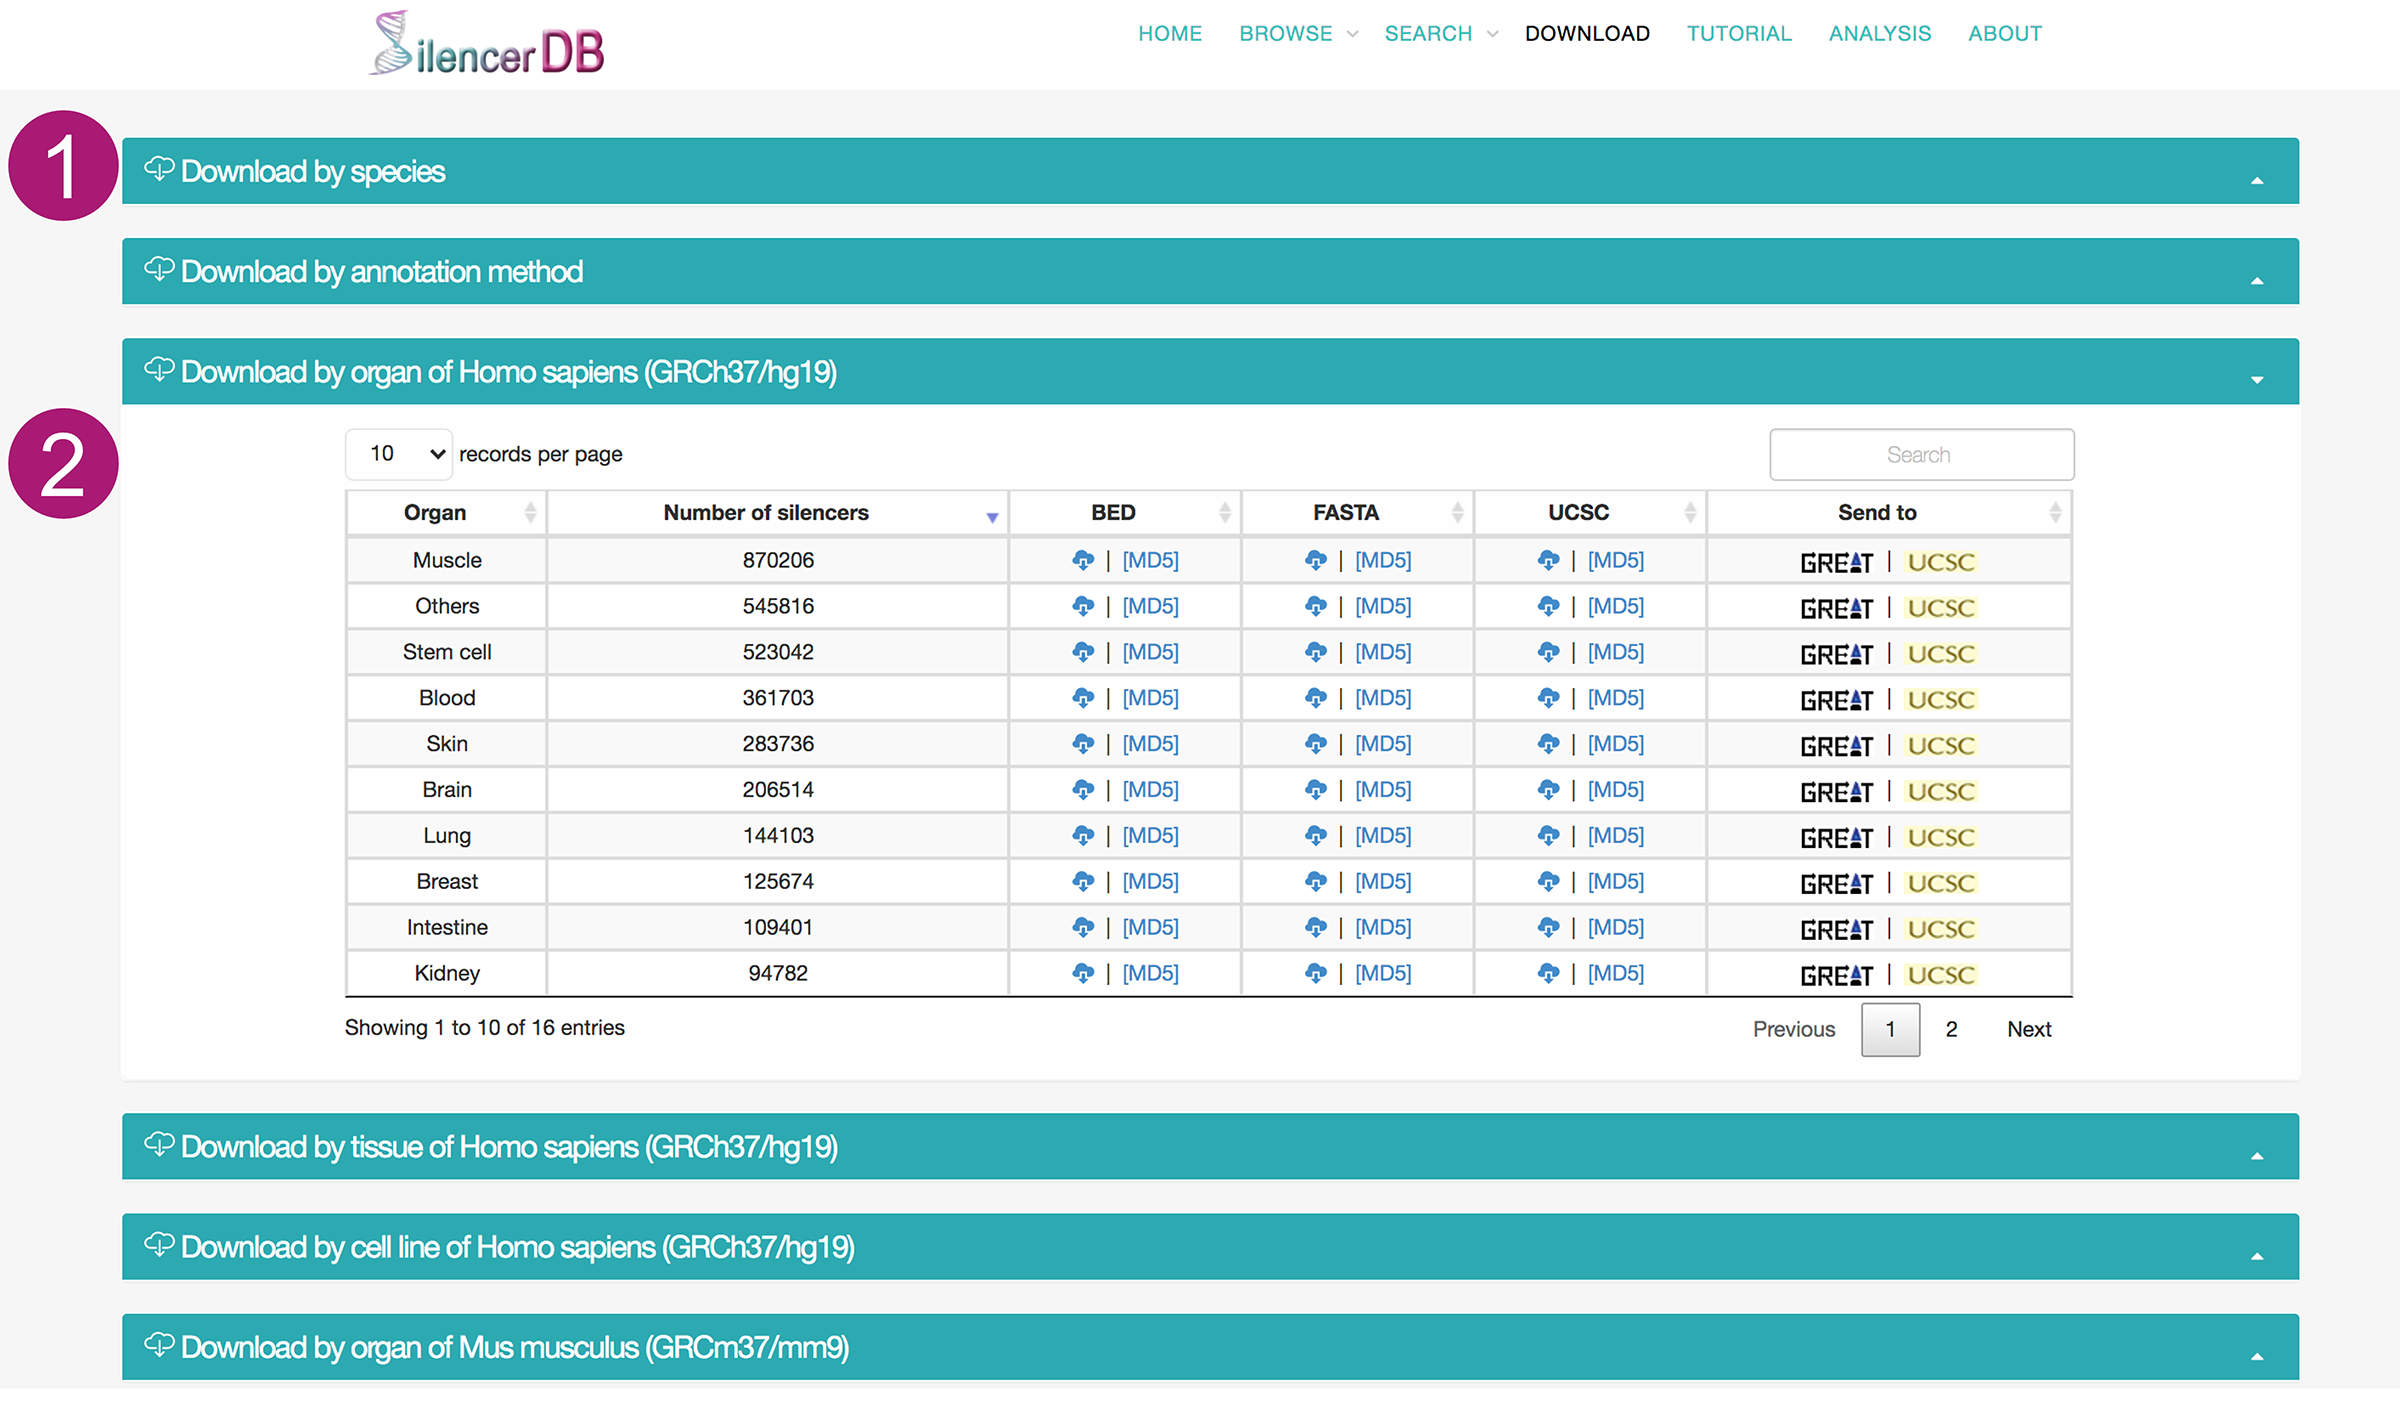
Download page
- We categorize the silencers by species, method, organ, tiuuse and cell line to facilitate the data downloading.
- The data can be downloaded in different formats like BED, FASTA, and UCSC custom tracks. The corresponding MD5 files are provided to ensure the integrity of the downloaded data. We also provide advanced features such as searching and sorting for the convenient usage. Moreover, each batch of silencers is coupled with two links, one to the UCSC Genome Browser with an automatically added custom track for visualization, and one to the Genomic Region Enrichment of Annotation Tool (GREAT) for functional prediction of the silencers by analyzing significant pathways and generating statistically associated annotations.
Analysis page
- Using the validated silencers of human K562 cell line, we provide a demo for the analysis of silencers. We walk through the workflow for the analysis of the length distribution of silencers, the distance between silencers and genes, the GC content of silencers, and the cell line specificity of silencers.

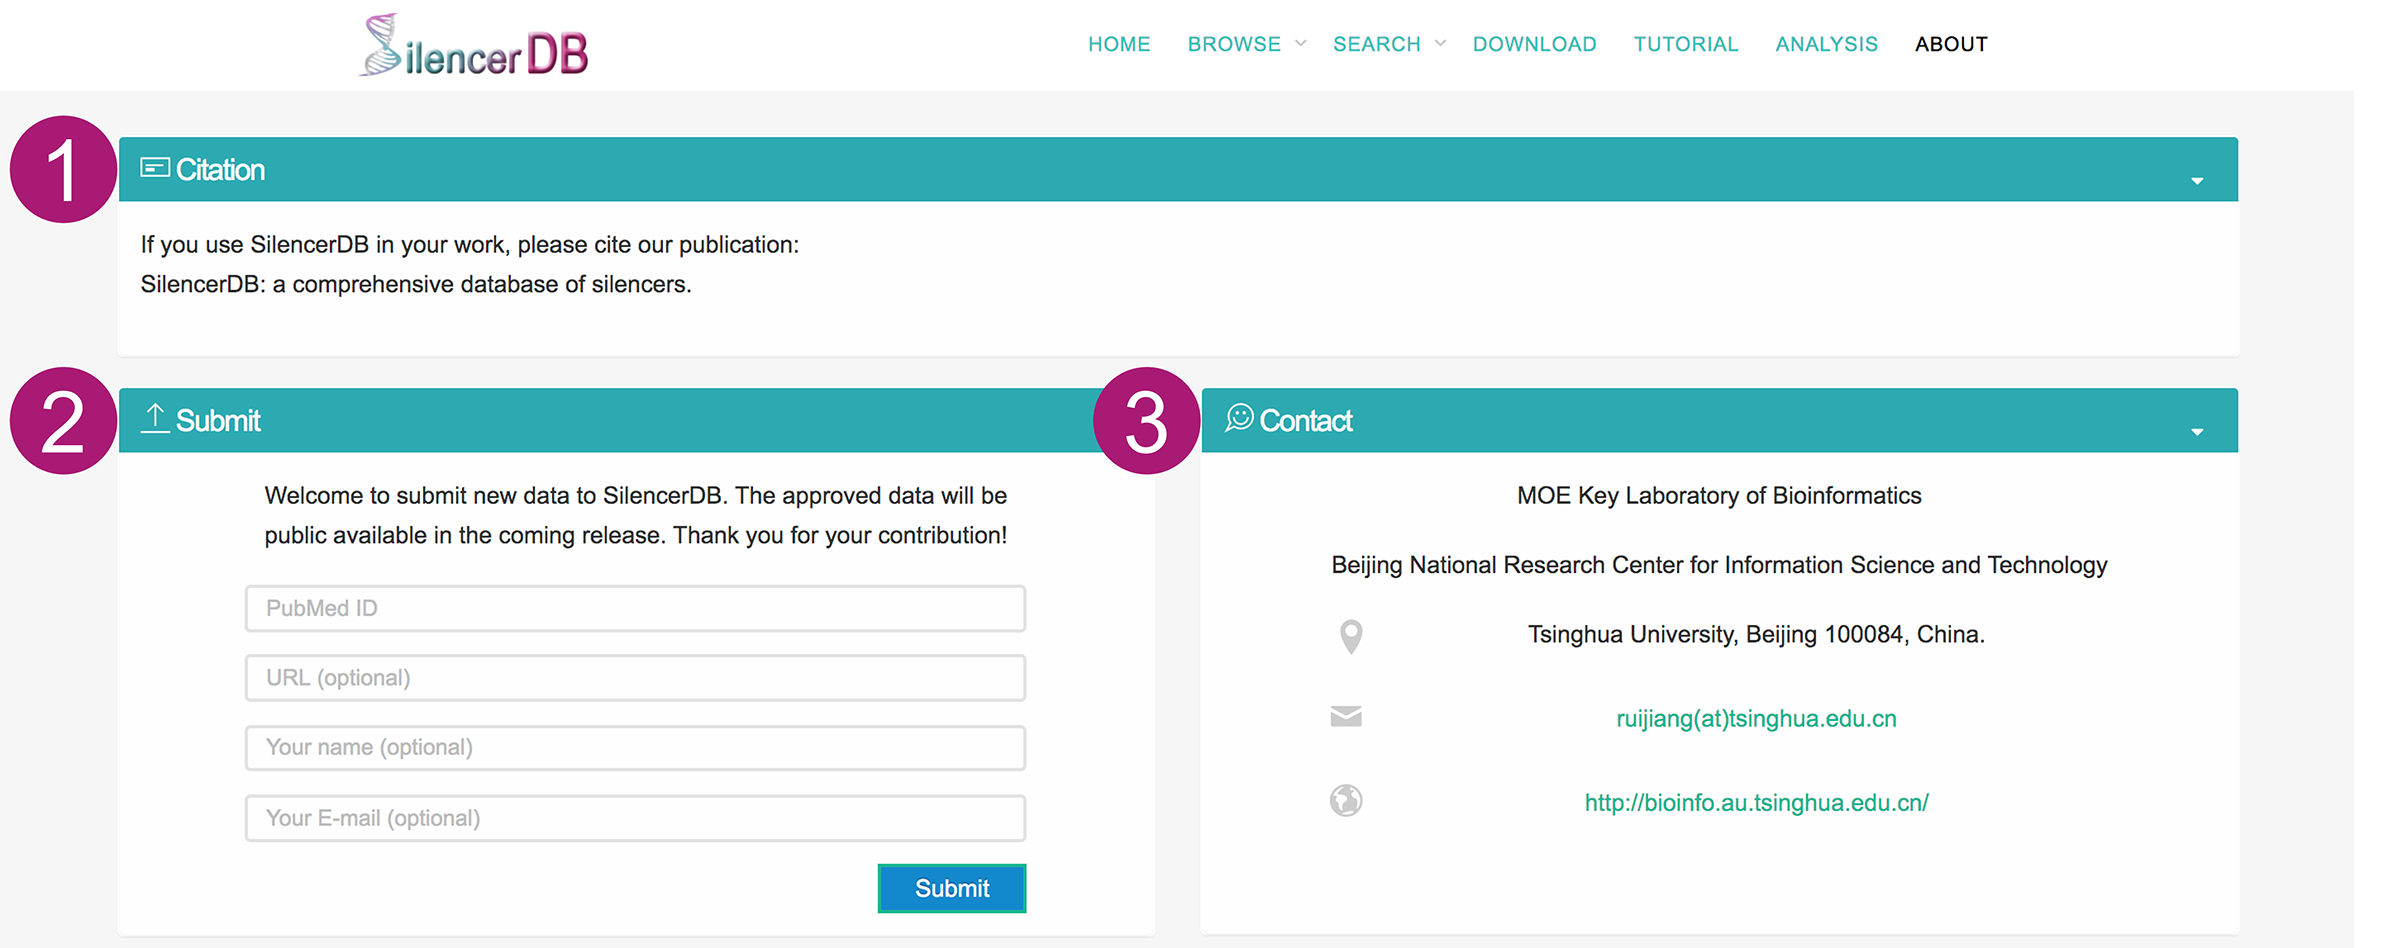
About page
- The citation information of SilencerDB.
- The interface for submitting data to SilencerDB. Users can submit their silencer data with the PubMed reference ID and optional information such as URL, name, and E-mail. The approved data will be public available in the coming release. We appreciate the users for their contribution.
- The contact information of SilencerDB. Please feel free to contact us if you have any question about SilencerDB.
The browser compatibility of SilencerDB
| Operating System | Version | Chrome | Firefox | Opera | Microsoft Edge | Safari |
|---|---|---|---|---|---|---|
| Windows | Windows 10 Pro | |||||
| MacOS | Sierra 10.12 | Linux | Ubuntu 16.04 |
Frequently asked questions
What is SilencerDB?
SilencerDB, to the best of our knowledge, is the first comprehensive database at this scale dedicated to silencers. With systematic data collection procedures, standardized datasets as well as a user-friendly web platform designed for research standards, we hope that SilencerDB can benefit biologists and data scientists to achieve a better understanding of the role of silencers in regulatory mechanisms and empower them to construct more comprehensive gene regulatory networks by combining negative regulatory mechanism of silencers with the positive one of enhancers. Moreover, since GWAS-identified risk variants in non-coding regions of the genome exert phenotypic effects through perturbation of transcriptional gene promoters, enhancers, silencers, etc., SilencerDB may have the potential to give insights to a more complete interpretation of GWAS risk variants and aid in developing new approaches for disease prevention and treatment.
What features SilencerDB?
- Comprehensive collection of silencers.
- Hierarchical categorization of silencers.
- Comprehensive annotation of silencers.
- User-friendly functionalities.
- The current version of SilencerDB contains 33,060 validated silencers and 5,045,547 predicted silencers. The detailed statistics of SilencerDB, including the number of silencers, the number of organs, tissues and cell lines in different species, are shown in Table 1.
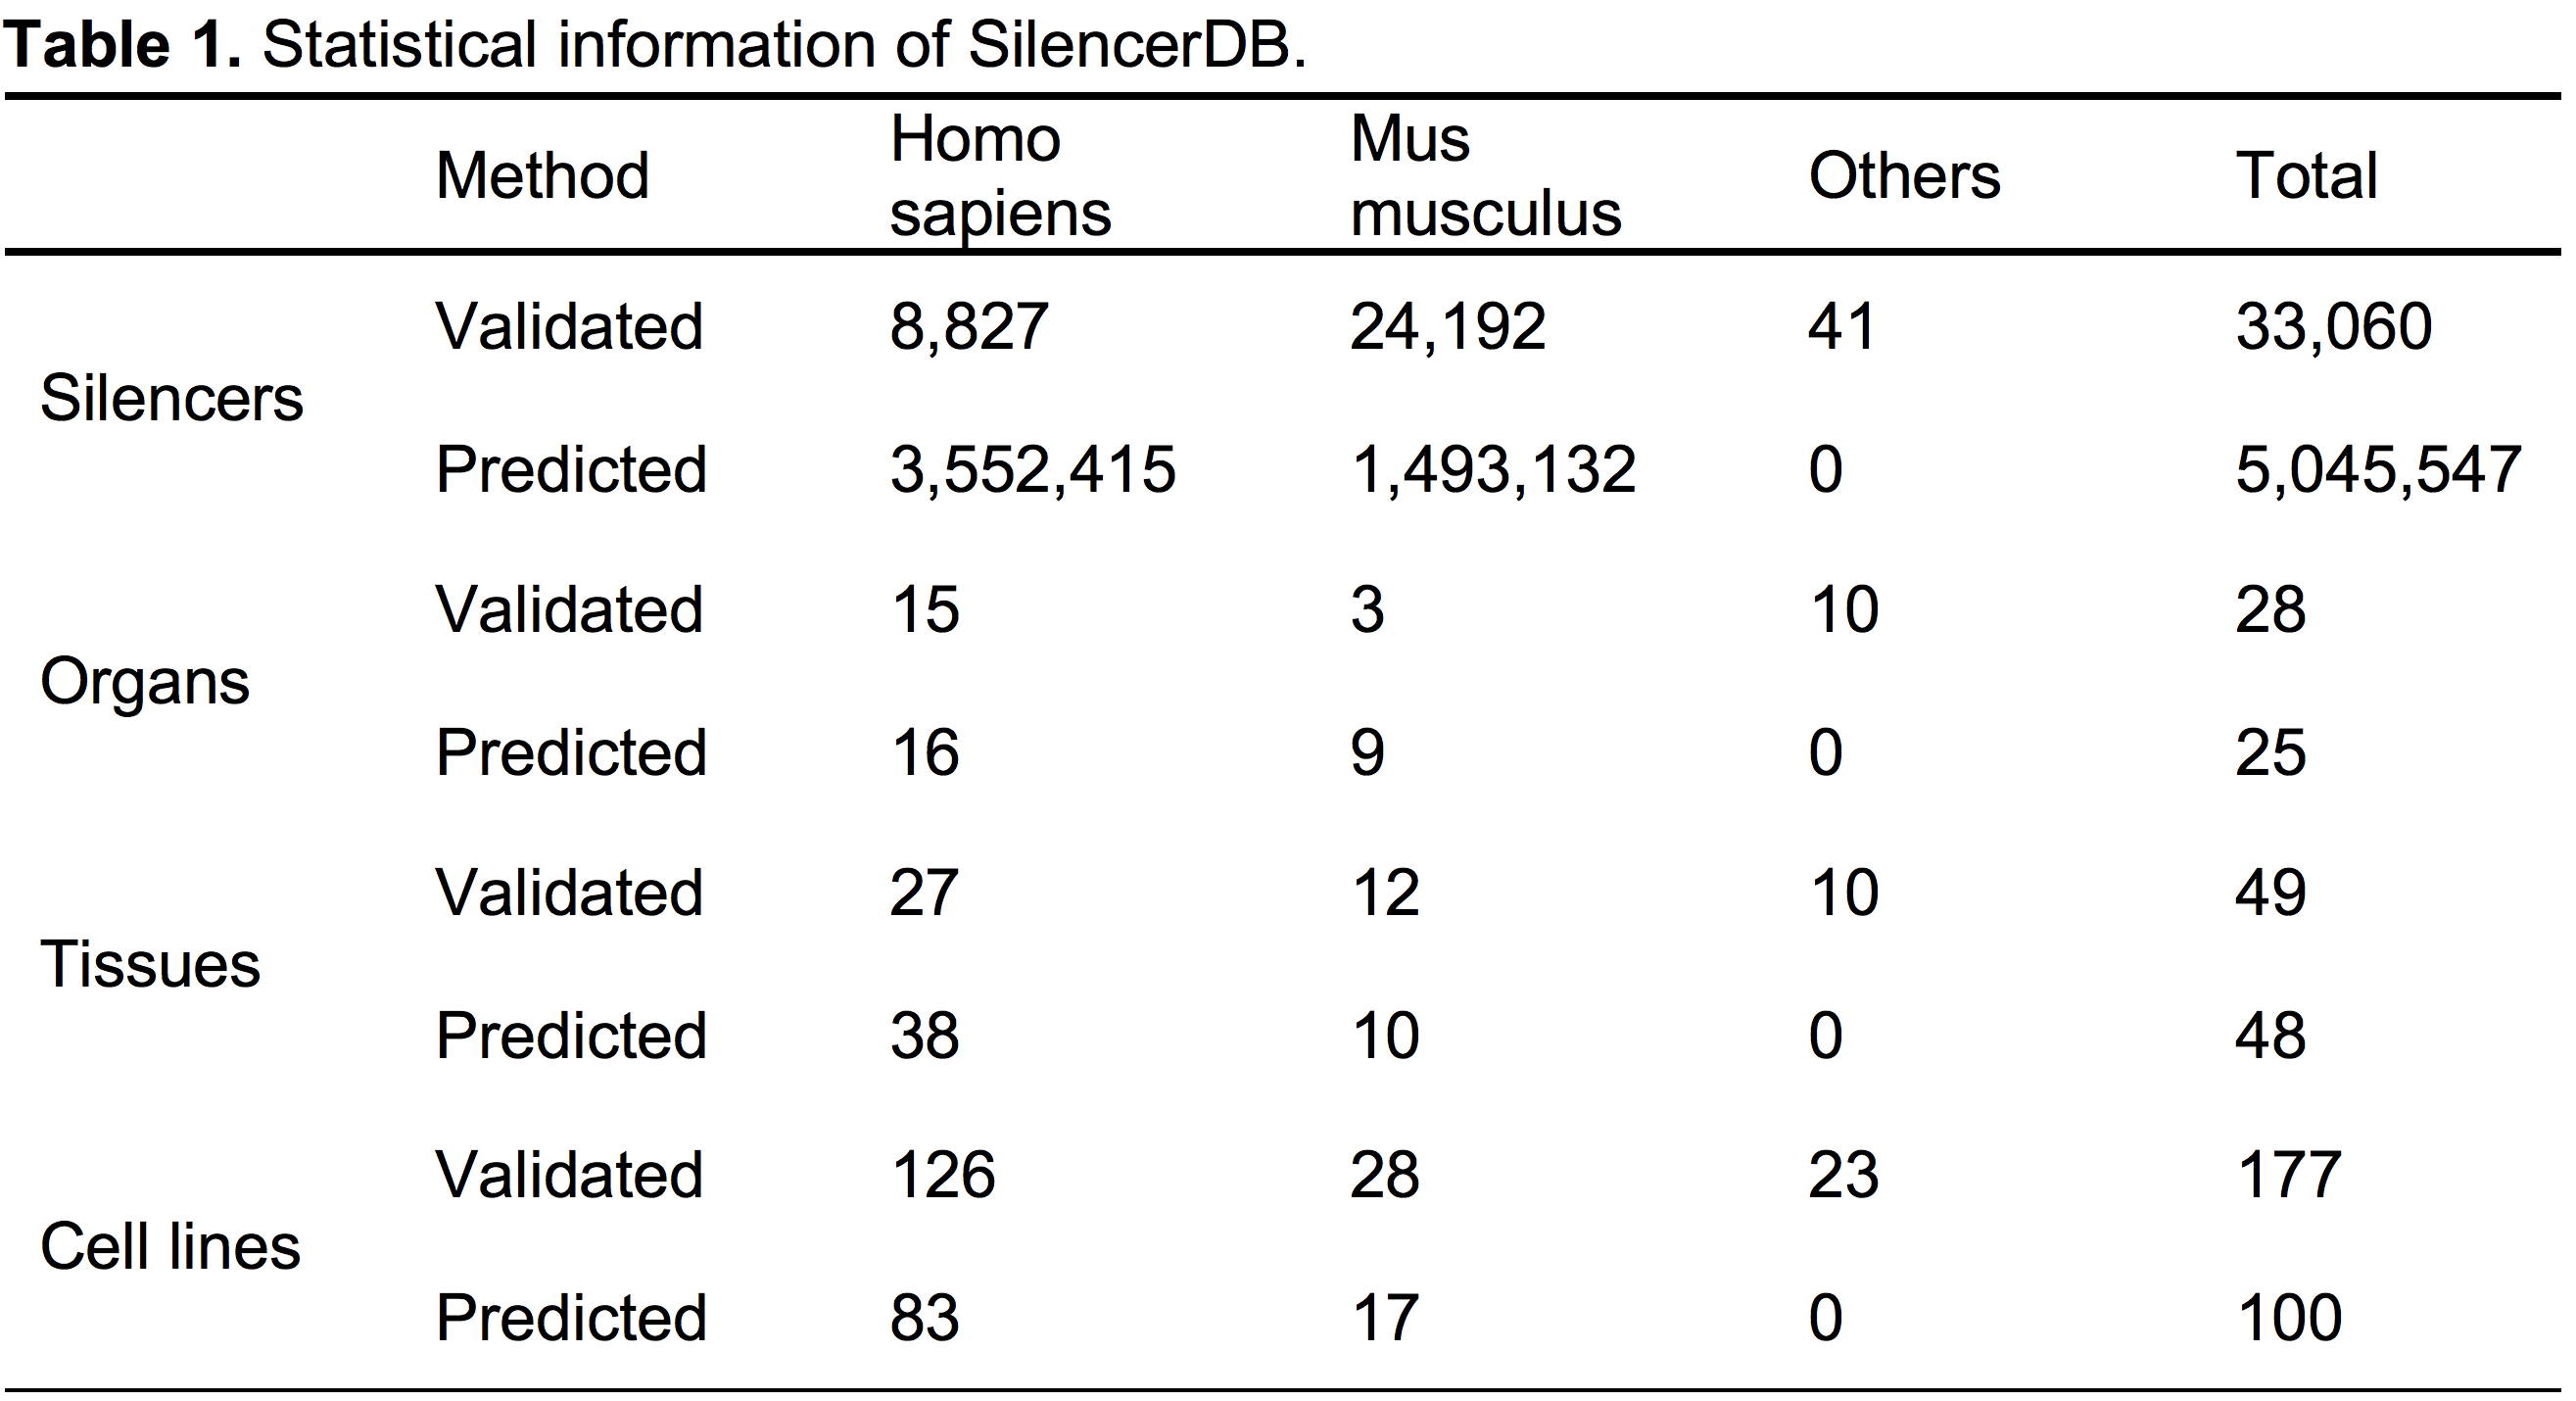
- SilencerDB contains silencers from 9 species, 35 organs, 75 tissues and 268 cell lines. For example, in human, validated silencers are derived from 15 organs, 27 tissues and 126 cell lines, and predicted silencers are derived from 16 organs, 38 tissues and 83 cell lines. In mouse, validated silencers are derived from 3 organs, 12 tissues and 28 cell lines, and predicted silencers are derived from 9 organs, 10 tissues and 17 cell lines. Most of human silencers are derived from muscle tissue (24.4%) and the H7-hESC cell line (6.2%). Most of mouse silencers are derived from brain tissue (58.1%) and the MEL cell line (8.0%).
- SilencerDB contained basic annotation including the silencer ID maintained by our database, genomic location, cell line, tissue, organ, species, the method used to identify the silencer as well as comprehensive gene annotation such as the nearest gene and potential regulatory genes predicted by PECA.
- SilencerDB provides user-friendly features such as distinctive visualization of categorization on the Home page, Statistical measures on the Brower page, advanced searching on the Search page, interactive visualization on the Detail page, convenient data downloading on the Download page and exemplary analysis on the Analysis page.
What methods are used to identify the silencers?
- For validated silencers:
- High-throughput (i.e. MPRA, CRISPR)
- Low-throughput (i.e. transient transfection assays, reporter assays)
- For predicted silencers:
- The correlation-based based model
- The SVM-based based model
- The gkmSVM-based based model
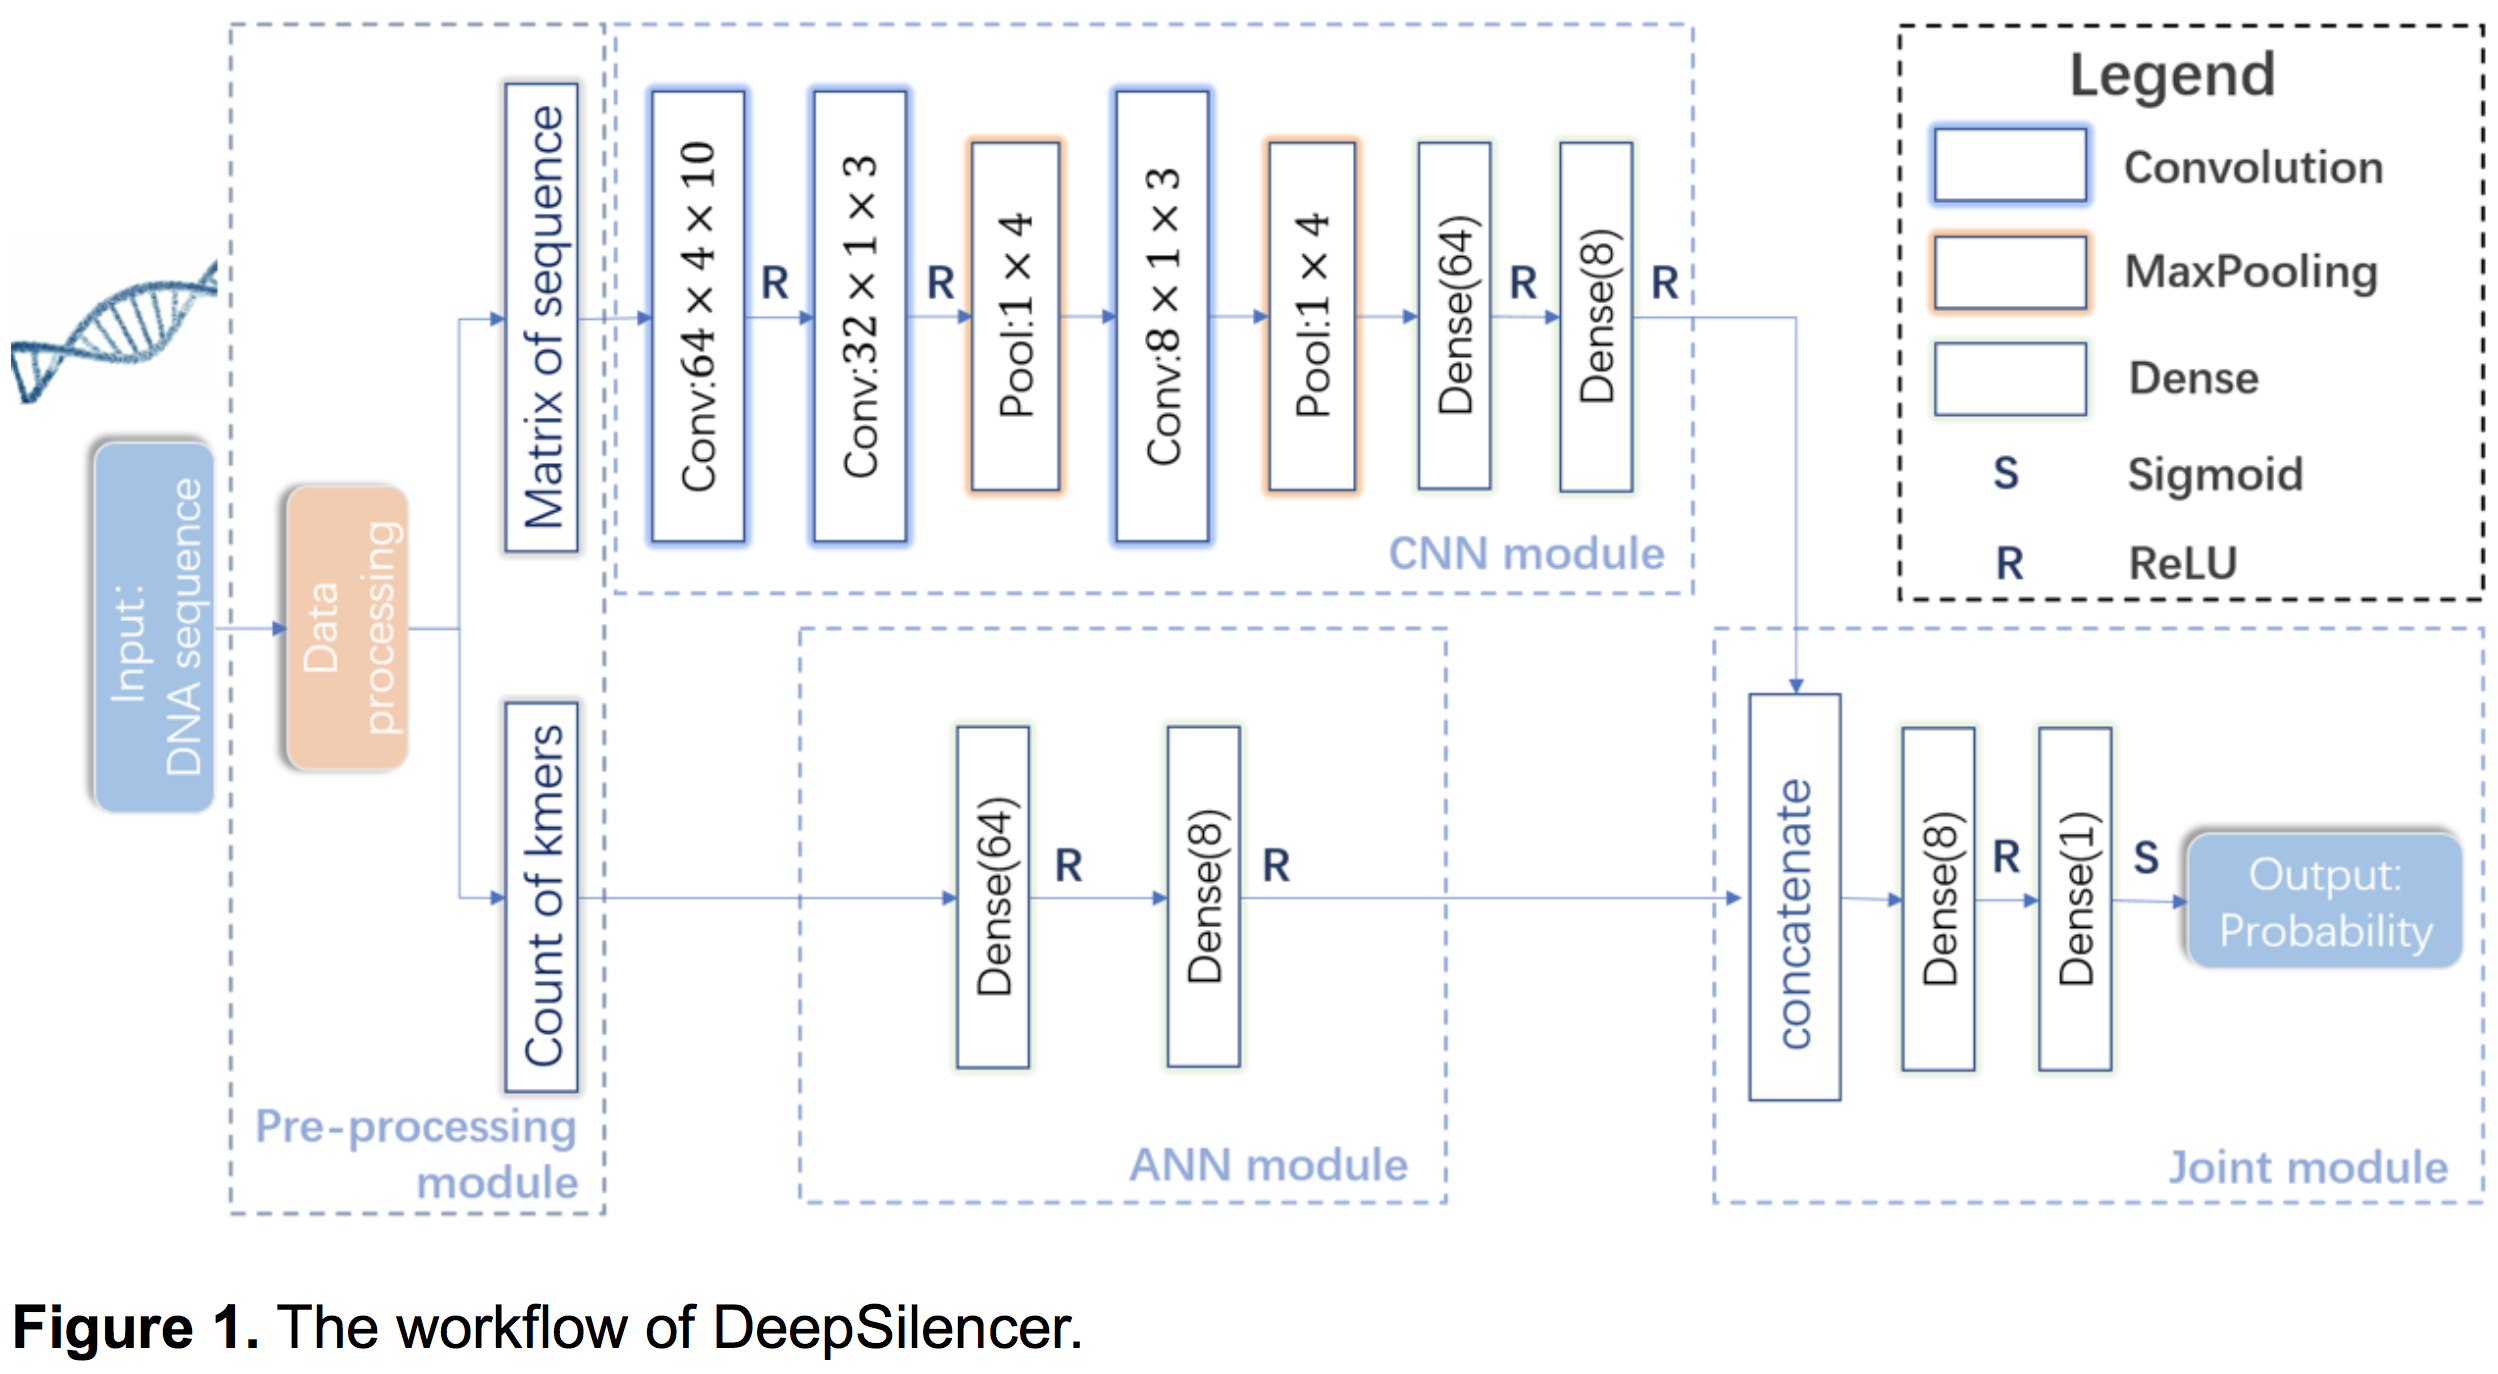
- The deep learning-based model, DeepSilencer
- As shown in Figure 1, DeepSilencer consists of four modules. First, a pre-processing module transforms DNA sequences into one-hot encoded matrices and vectors of k-mers counts. Second, a convolutional neural network (CNN) module uses multiple convolutional and pooling layers to extract features from the one-hot encoded DNA sequences. Third, an artificial neural network (ANN) module is adopted to sufficiently learn features from k-mers. Finally, a joint module integrates outputs of the CNN and ANN modules to predict whether the input sequence is a silencer or not. The detailed network structure and hyper-parameters of DeepSliencer can be found in GitHub.
What is the difference between validated silencers and other open regions?
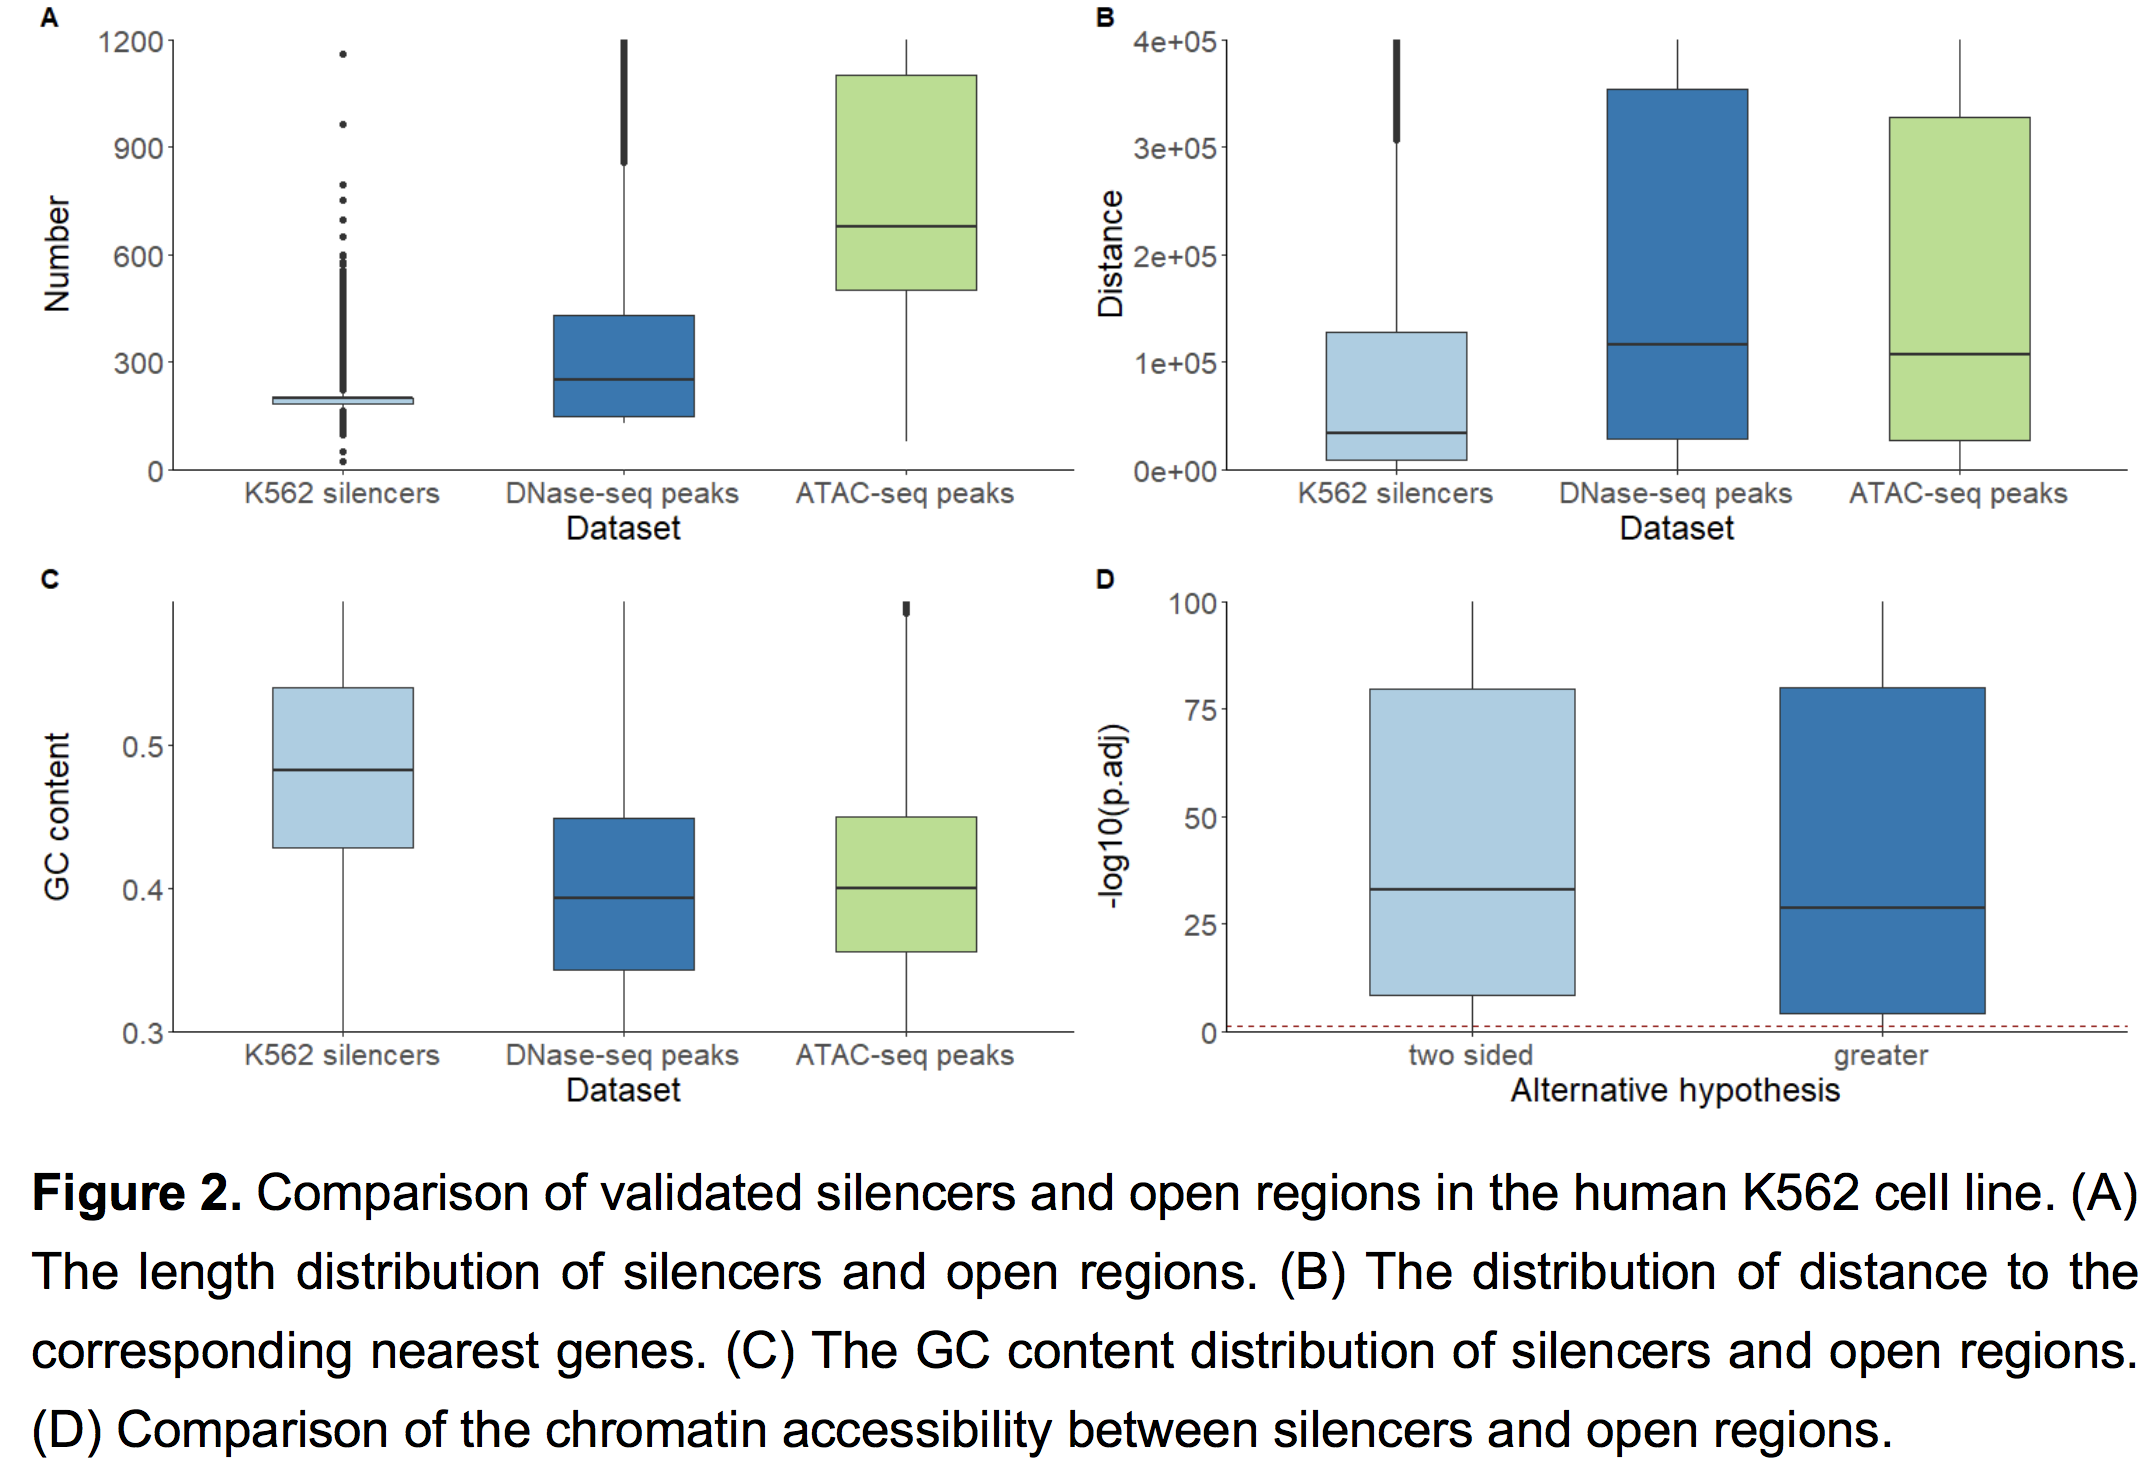
To investigate the difference between validated silencers and other open regions, we systematically compared validated silencers and other open regions in human K562 cell line. We obtained two datasets of open regions in K562 (DNase-seq peaks and ATAC-seq peaks) from NCBI as a baseline. The length distributions of validated silencers and that of open regions in K562 are shown in Figure 2A. The lengths of silencers are mainly between 100~300bp, while the lengths of open regions are mainly between 200~400 bp for the DNase-seq dataset and 600~1000 bp for the ATAC-seq dataset (Figure 2A). The distributions of distance from silencers and open regions to corresponding nearest genes are shown in Figure 2B. The average distance from a silencer to its nearest coding gene is 61,721 bp, which is significantly less than that from a DNase-seq peak to its nearest coding gene (144,767 bp, one-sided Wilcox test p-value<2.2e-16)) and from an ATAC-seq peak to its nearest coding gene (132,892 bp, one-sided Wilcox test p-value<2.2e-16)). The GC content distribution of regions in different datasets is shown in Figure 2C. On average, the GC content of validated K562 silencers is 0.4896, which is much higher than that of DNase-seq peaks (0.4266, one-sided Wilcox test p-value<2.2e-16) and ATAC-seq peaks (0.4222, one-sided Wilcox test p-value<2.2e-16). We performed one-sided Wilcoxon test and two-sided Wilcoxon test for silencer openness scores in K562 against the remaining 198 cell lines and obtained 198 FDR p-values using Benjamini and Hochberg correction respectively. The one-sided and two-sided p-value distributions are shown in Figure 2D, suggesting the cell line specificity of silencers.
What methods are used to identify the target genes of silencers?
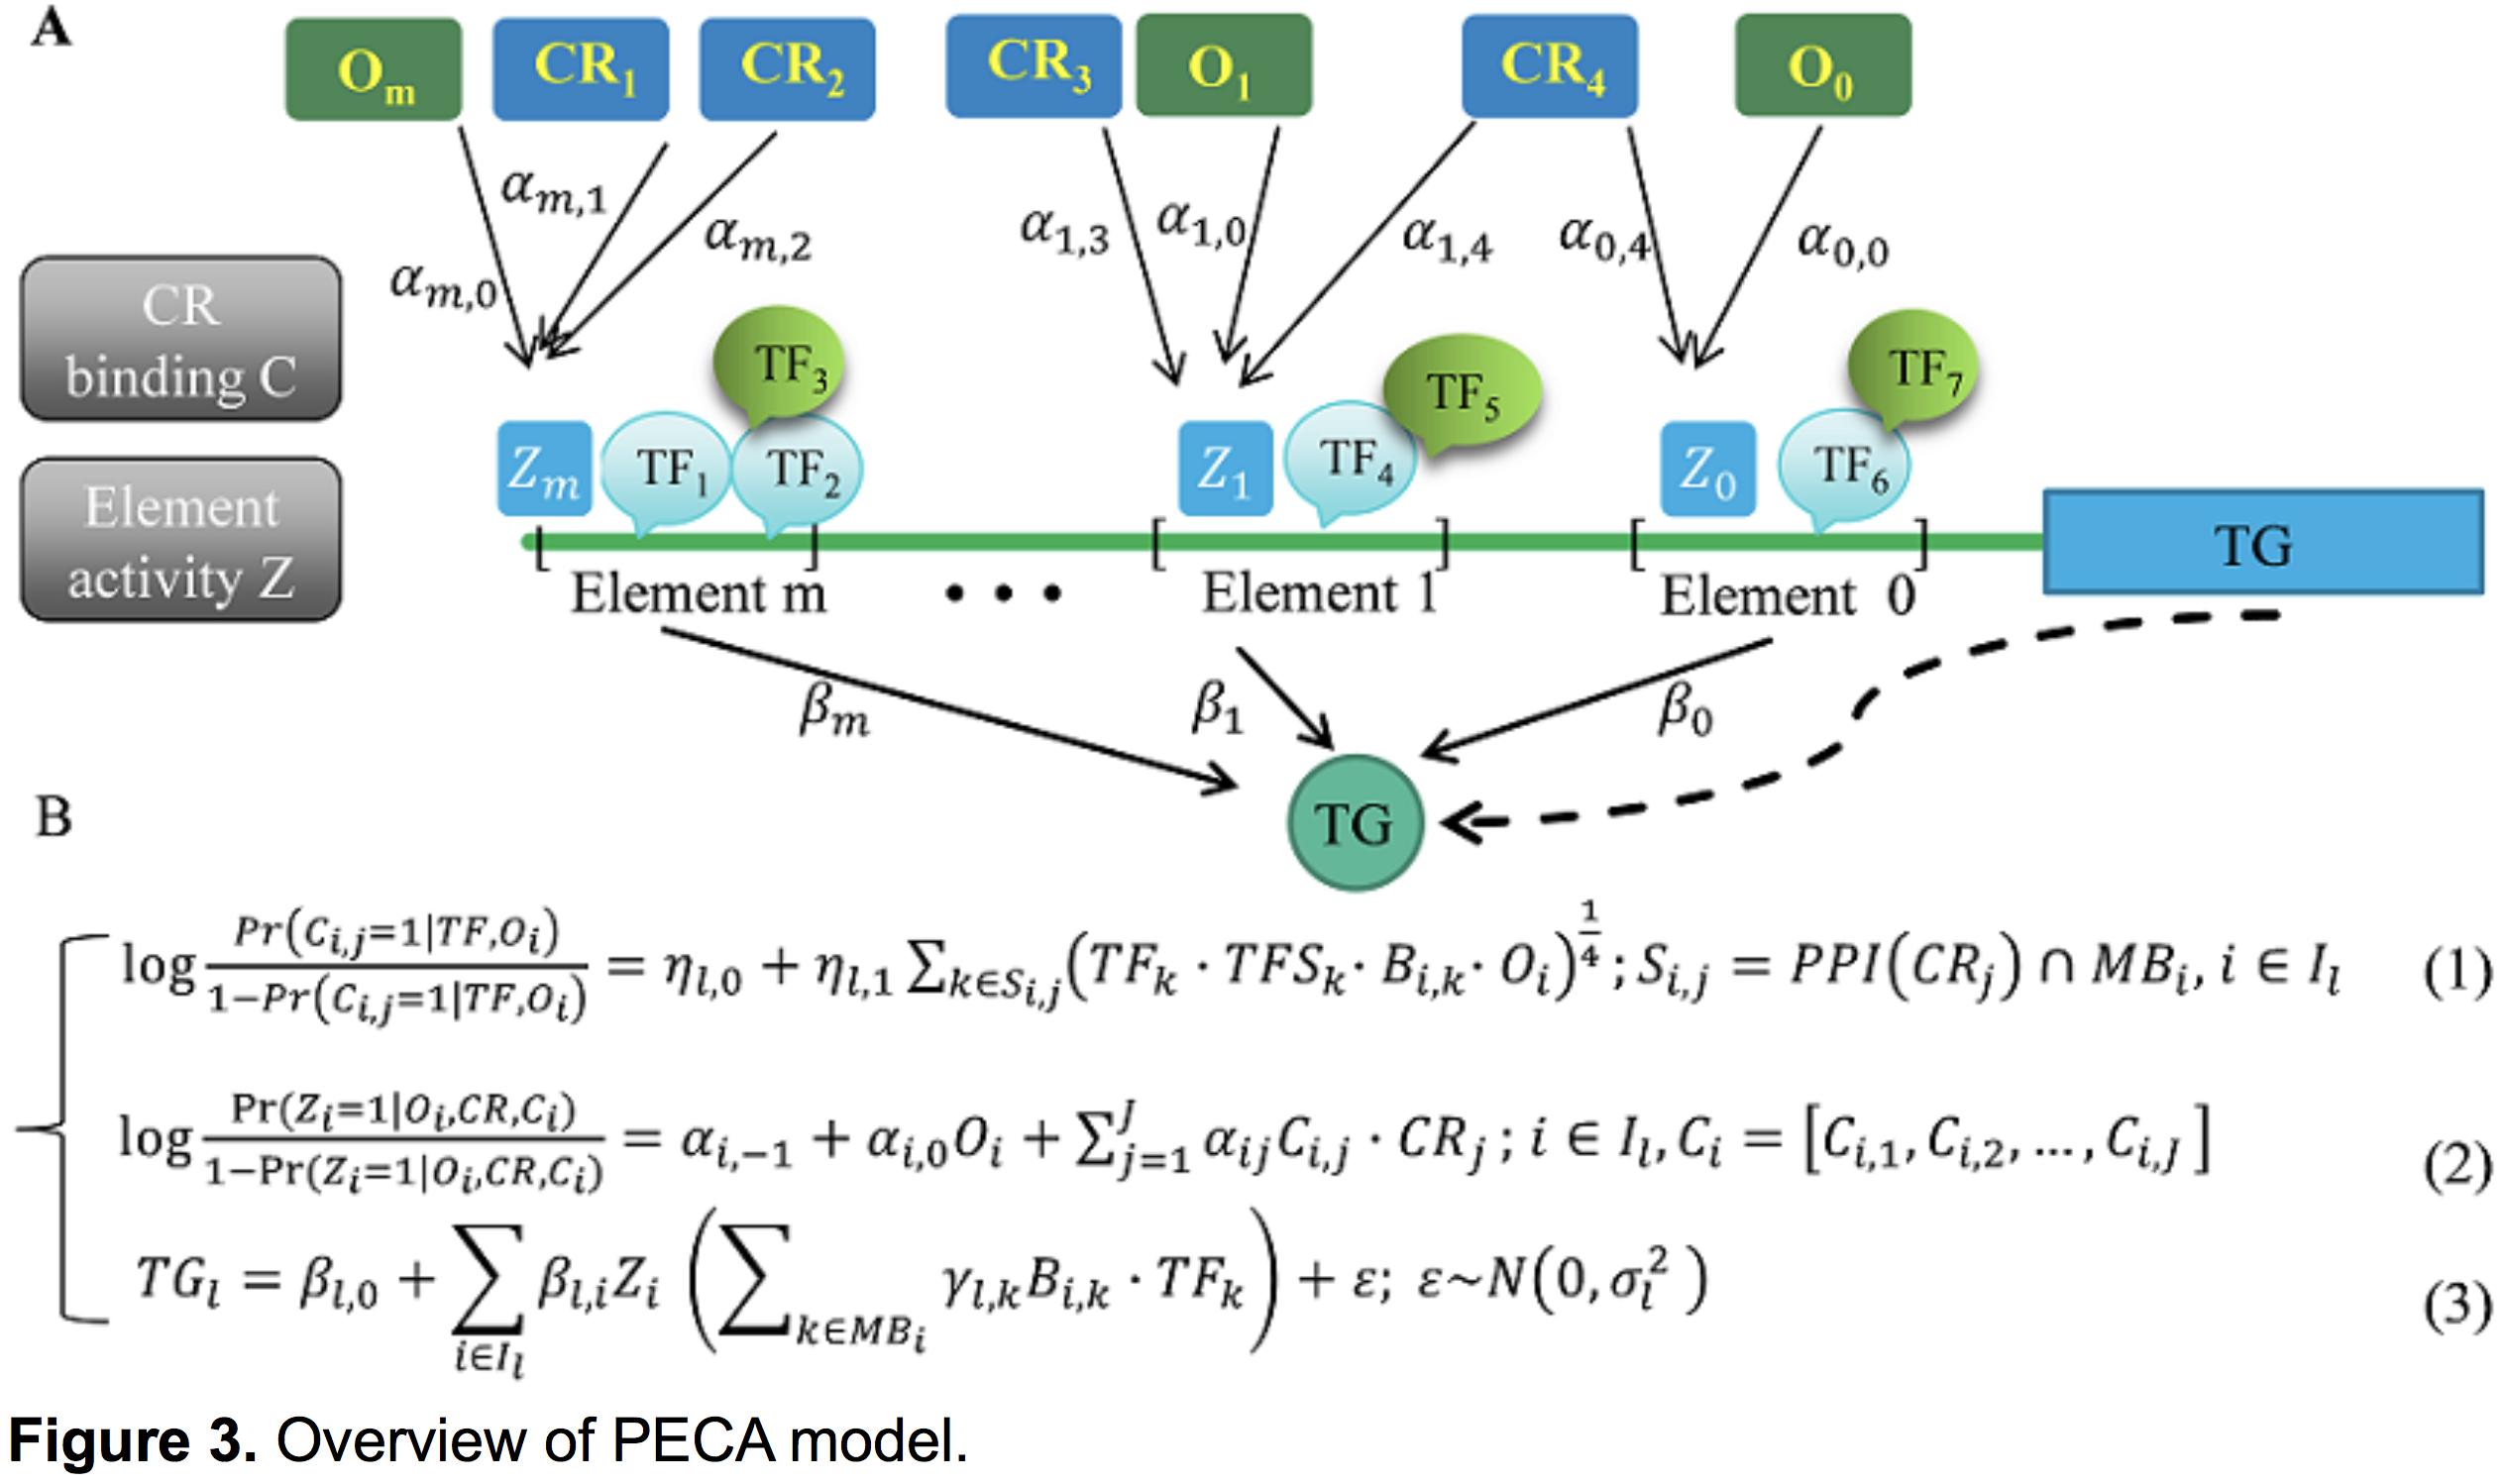
We identified potential target genes of silencers using 1) the nearest gene based on genomic location, 2) potential regulatory genes based on the PECA model. PECA is a statistical approach based on paired expression and chromatin accessibility data across diverse cellular contexts. As shown in Figure 3, PECA models 1) the localization to REs of chromatin regulators (CR) based on their interaction with sequence-specific TF, 2) the activation of REs due to CRs that are localized to them, 3) the effect of TFs bound to activated REs on the transcription of target genes (TG). The transcriptional regulatory network inferred by PECA provides a detailed view of how trans- and cis-regulatory elements work together to affect gene expression in a context-specific manner. Since both the nearest genes and PECA predicted genes are the potential target genes of silencer, for a specific silencer, they may be the same and they can be different.
Why is it slow to load SilencerDB for the first time?
The first time the browser opens SilencerDB, it needs to load some web plug-ins for advanced visualization and table features, resulting in the slow loading. We have been working on optimizing the experience of using SilencerDB.
Do you have any example for demonstrating the importance of silencers?
The accurate identification of silencers has the potential to give insights to a more complete interpretation of GWAS risk variants and aid in developing disease therapy method. For example, Yan et al. identified a tissue-specific silencer element in the first intron of the human acid ankyrin-1 gene. It has been shown that the expression of a housekeeping gene, the human ankyrin-1 gene, can be trans-activated by overexpressed transcription factor GATA-1, indicating that it is feasible to manipulate housekeeping gene transcription. In those cases of GSD II in which enzyme activity is present but at reduced levels - in particular, in those cases of late-onset disease in which the message is normal, up-regulation of the gene would hold out the possibility of effective therapy.