A demo for the analysis of scATAC
Here, we will use the lv_SM-JF1NY sample from the HGCA dataset as an example to demonstrate how to perform a basic analysis of single-cell chromatin accessibility data from the heart. After data preprocessing, we can use UMAP to plot a low-dimensional representation of these data, which helps in better visualizing the distribution of open regions and cell types across the dataset.

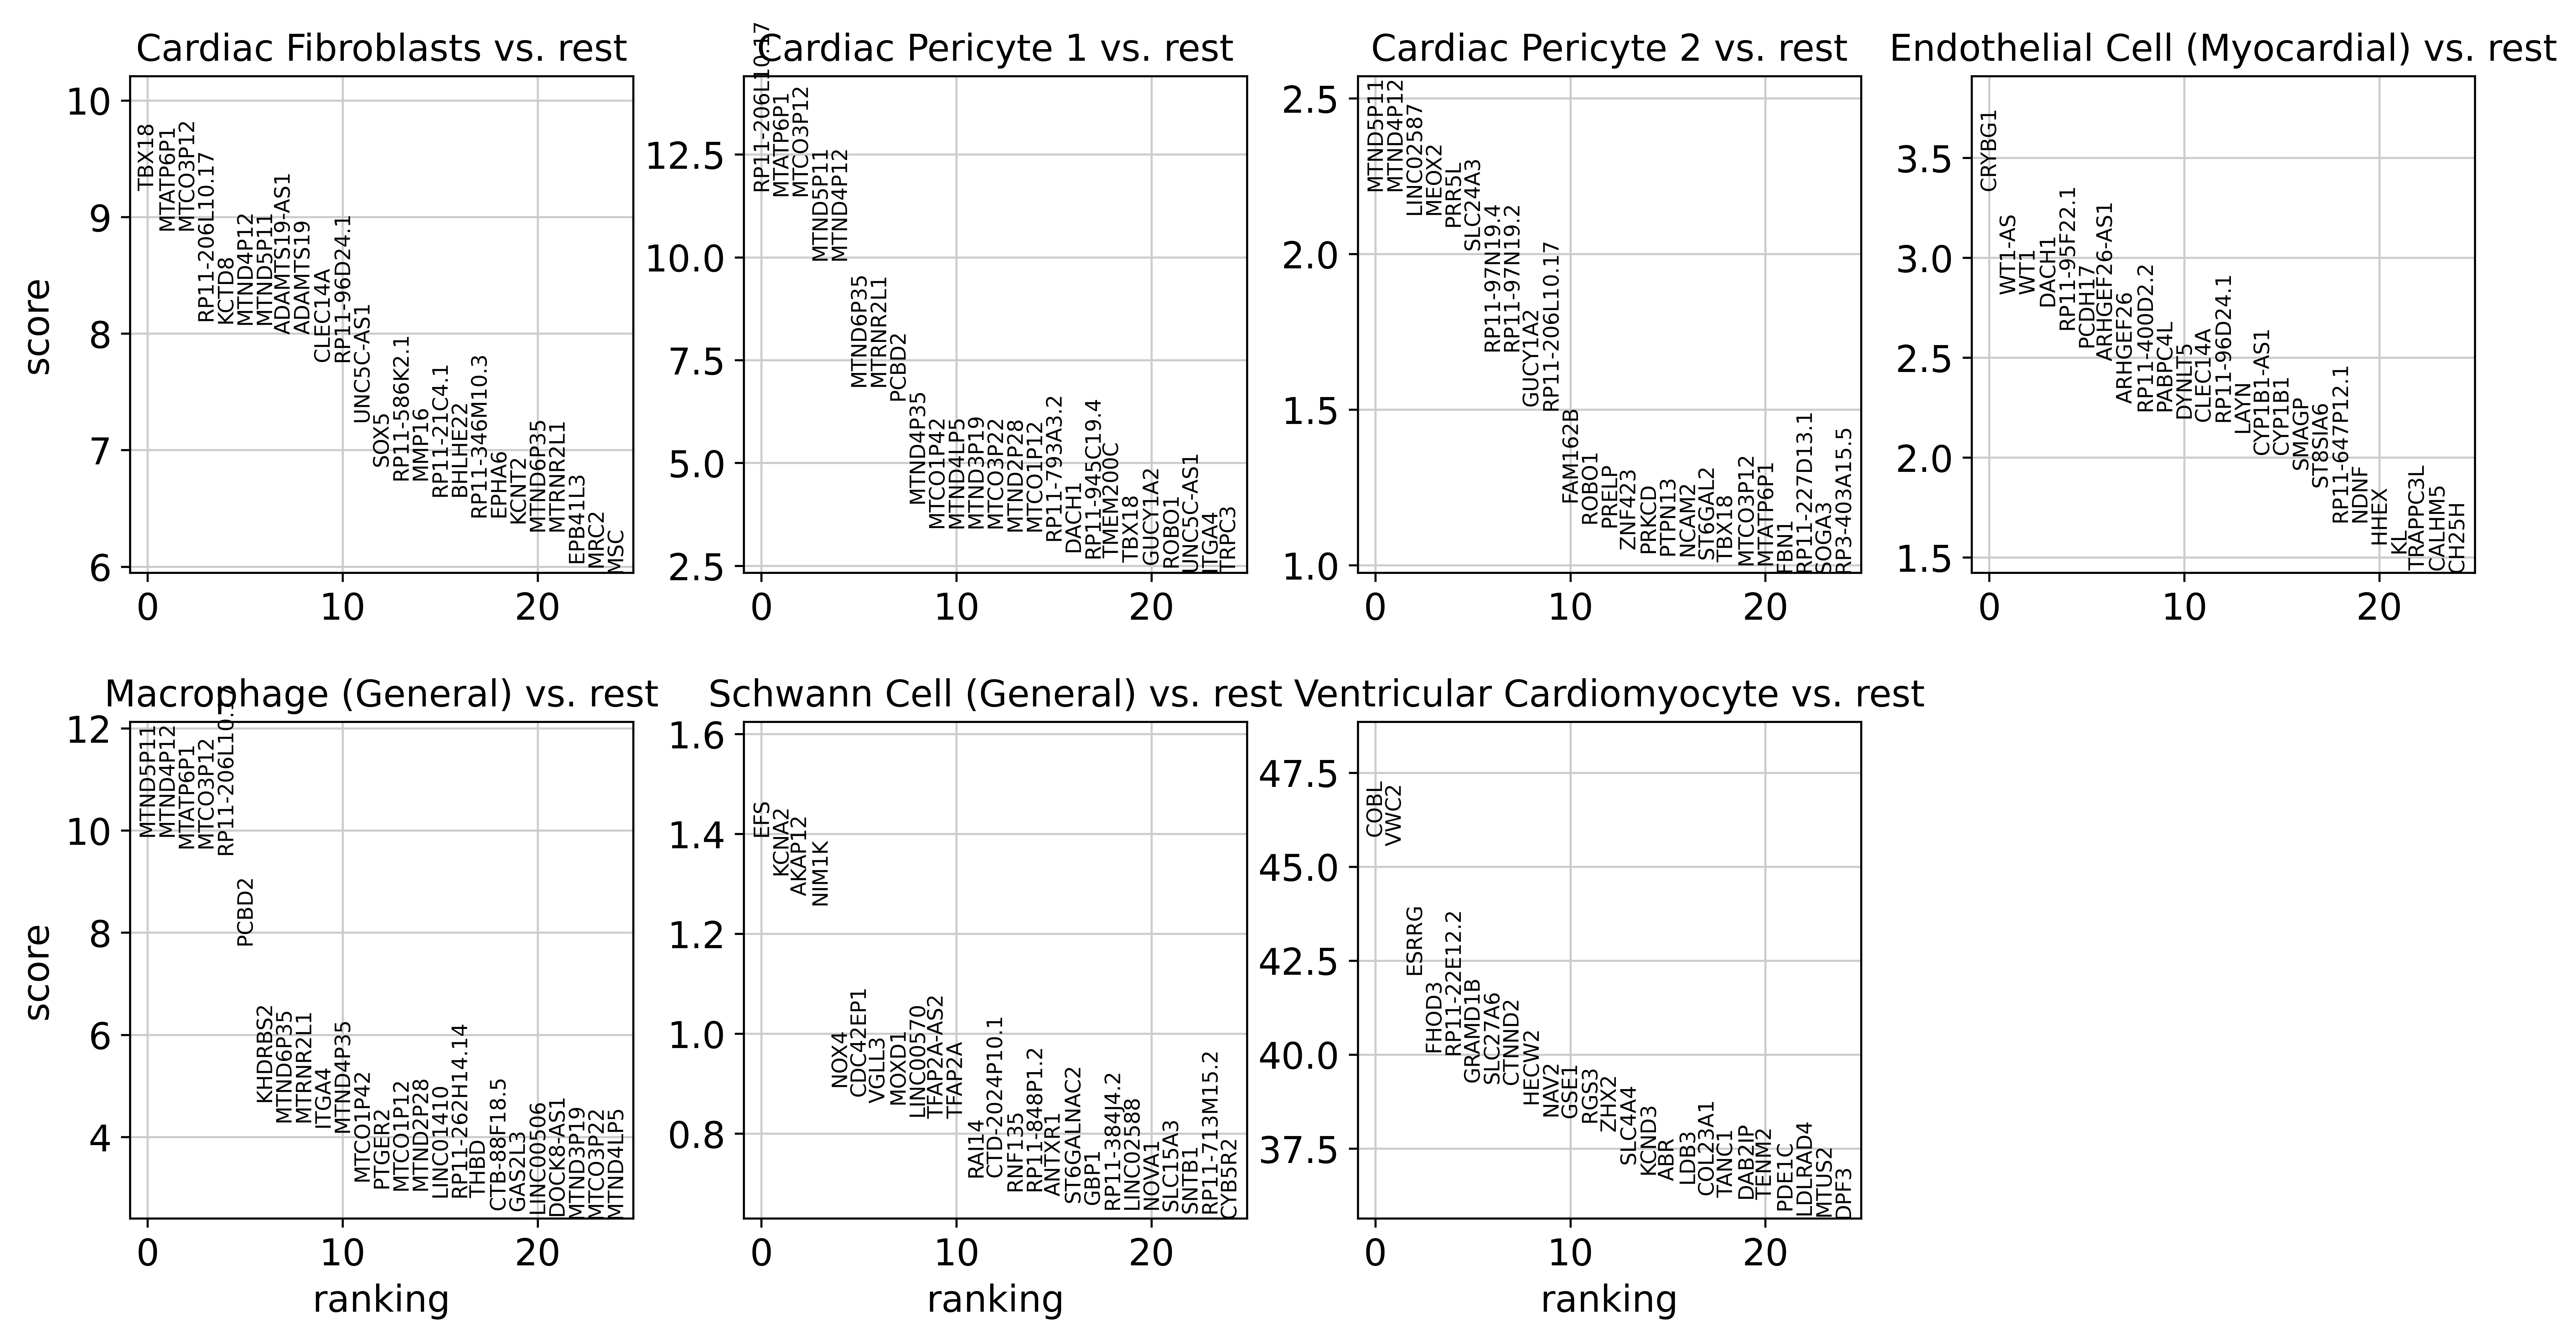
Then, we can identify cell-type-specific open regions.

Using the EpiScanpy toolkit and genome annotation files, we can convert single-cell chromatin accessibility data into gene activity scores, allowing for analysis at the transcriptome level.

