The documentation of CASHeart
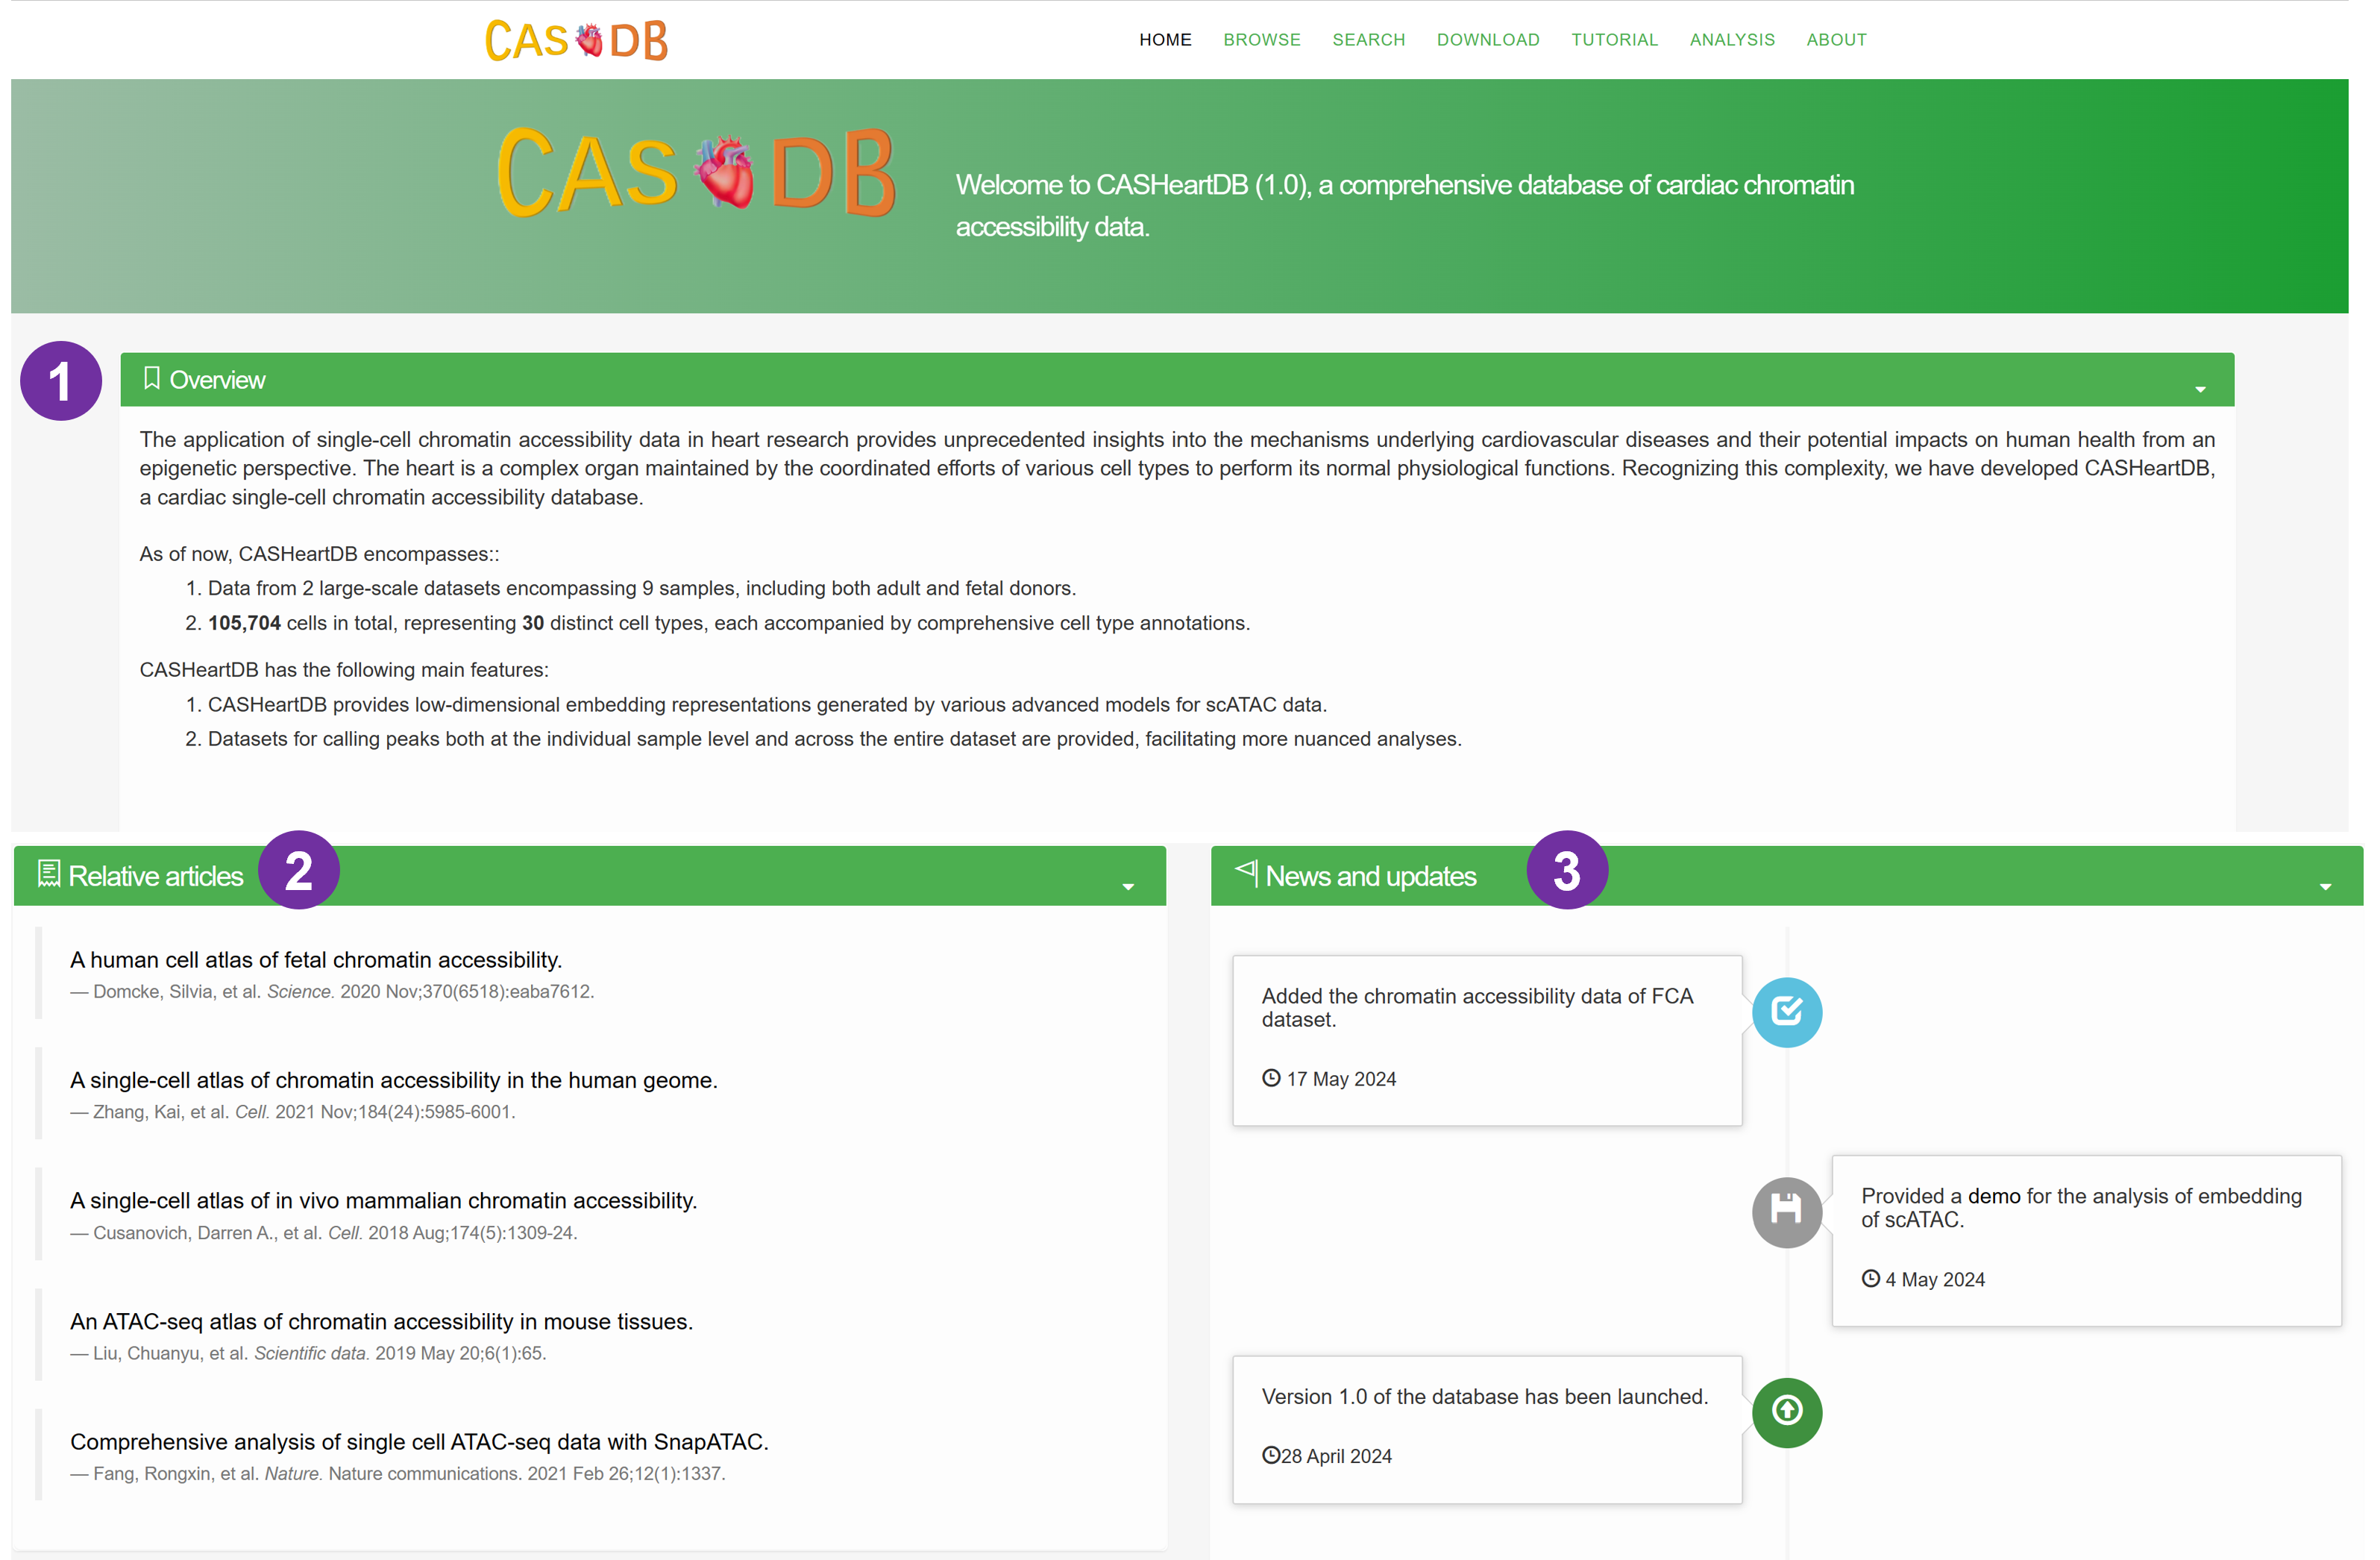
Home page
- A simple introduction about the CASHeart, with a global view of cell type maps of human heart.
- The overview of the database.
- The number of cells and samples of the database.
- The features of the database.
- Recent articles about the data and analysis of scATAC data.
- News and updates of CASHeart.

Browse page
- Users can browse data of interest by selecting a dataset, sample, or cell type in the hierarchical tree.
- We provide comprehensive statistics and visualization with respect to the selected subset of scATAC data.
- UMAP visualizations annotated by cell type labels.
- UMAP visualizations labeled according to Louvain clustering.
- UMAP visualizations categorized by sample labels.
- Bar plots depicting the distribution of either sample types or cell type counts.
- The selected subset of data are displayed on a interactive table.

Search page
- Users can search for data of interest by selecting a dataset from the pull-down menu, and then selecting multiple samples and cell types from the pull-down menu with advanced features such as searching and selecting-all.
- Users can click on the 'Example' button to obtain a demonstration for how to conduct a search.
- The results will be displayed on an interactive table.
- Users can click on the column header, such as the 'Open Ratio', to sort the searched cellular data.
- By clicking the 'Download' button, users can obtain the compressed results.

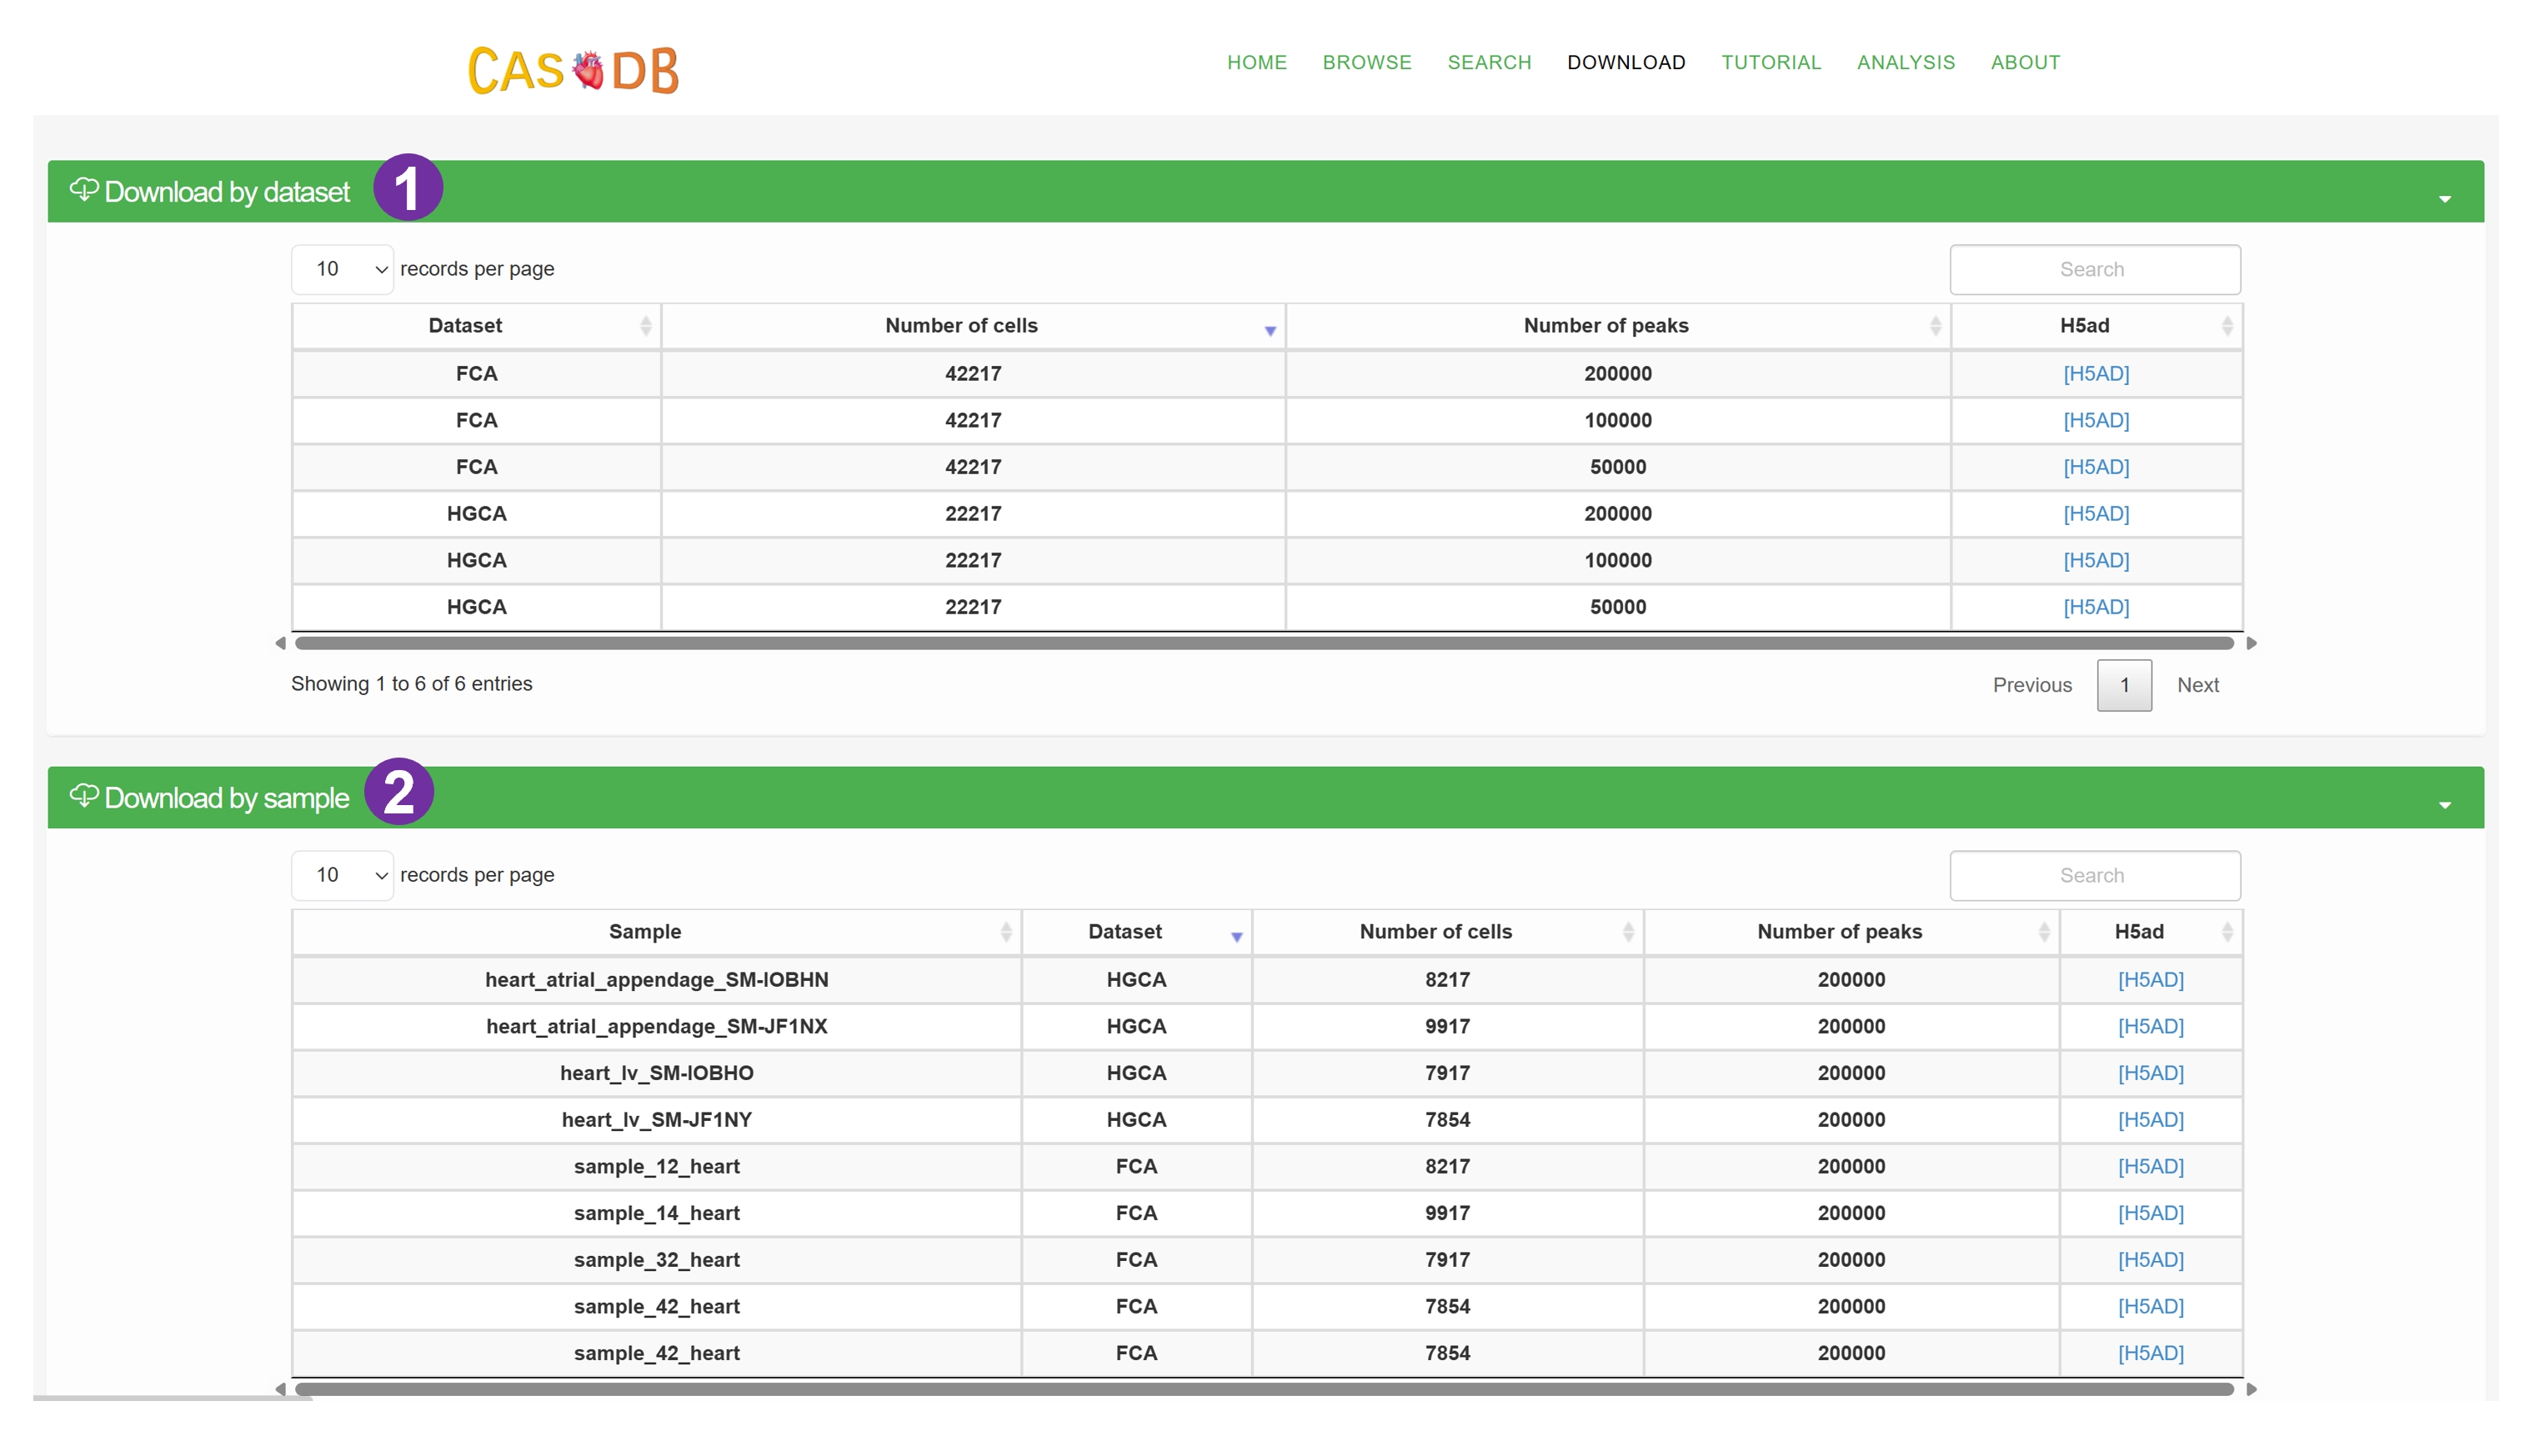
Download page
- We categorize the scATAC data by dataset, sample and cell type to facilitate the data downloading.
- The downloaded data is stored in H5AD format. For detailed information about this format, please visit here.

Analysis page
- Using the validated silencers of human K562 cell line, we provide a demo for the analysis of silencers. We walk through the workflow for the analysis of the length distribution of silencers, the distance between silencers and genes, the GC content of silencers, and the cell line specificity of silencers.

About page
- The citation information of CASHeart.
- The contact information of CASHeart. Please feel free to contact us if you have any question about CASHeart.

The browser compatibility of CASHeart
| Operating System | Version | Chrome | Firefox | Opera | Microsoft Edge | Safari |
|---|---|---|---|---|---|---|
| Windows | Windows 10 Pro | |||||
| MacOS | Sierra 10.12 | Linux | Ubuntu 16.04 |
Frequently asked questions
What is chromatin accessibility?
Chromatin accessibility refers to the degree to which large molecules within the cell nucleus,
such as transcription factors and RNA polymerase, physically interact with the DNA in chromatin. It reflects the open state
of chromatin structure, where "open" regions allow regulatory proteins to more easily bind to DNA, thereby influencing the
transcriptional activity of genes. The open or closed state of chromatin is primarily determined by the arrangement of
nucleosomes, histone modifications, and the presence or absence of other chromatin-binding factors.
Understanding chromatin accessibility is crucial for elucidating the mechanisms of gene expression regulation, particularly in processes such as cell differentiation, development, and disease progression. Studying chromatin accessibility can help scientists identify potential functional elements in the genome, such as enhancers and promoter regions, which are often highly accessible in specific cell types or physiological states.
Understanding chromatin accessibility is crucial for elucidating the mechanisms of gene expression regulation, particularly in processes such as cell differentiation, development, and disease progression. Studying chromatin accessibility can help scientists identify potential functional elements in the genome, such as enhancers and promoter regions, which are often highly accessible in specific cell types or physiological states.
What is scATAC data?
scATAC data refers to data generated using the scATAC-seq (Single-cell Assay for Transposase-Accessible Chromatin
using sequencing) technique. scATAC-seq is an advanced single-cell analysis method used to determine the accessibility of chromatin
in each individual cell. This technology allows researchers to explore the heterogeneity of chromatin structure among individual cells
within a cell population, identifying which DNA regions are open and which may be closed in different cells.
Through scATAC-seq, researchers can identify open chromatin sites where transcription factors may bind within individual cells. This is crucial for understanding gene expression regulation, cell fate determination, and differences between cells in developmental biology, cancer research, and other complex biological processes. The generated data contain a large amount of sequence read information, which requires complex bioinformatic analysis to decipher the chromatin accessibility status of each cell. Further analysis includes cell type annotation, pathway analysis, and construction of gene regulatory networks..
Through scATAC-seq, researchers can identify open chromatin sites where transcription factors may bind within individual cells. This is crucial for understanding gene expression regulation, cell fate determination, and differences between cells in developmental biology, cancer research, and other complex biological processes. The generated data contain a large amount of sequence read information, which requires complex bioinformatic analysis to decipher the chromatin accessibility status of each cell. Further analysis includes cell type annotation, pathway analysis, and construction of gene regulatory networks..
What is the low-dimensional embedding representation of scATAC data?
The low-dimensional embedding representation of scATAC data refers to the process of transforming high-dimensional data generated by scATAC-seq into a lower-dimensional space using mathematical dimensionality reduction techniques, facilitating visualization, clustering analysis, and biological interpretation. Due to the typically high dimensionality of scATAC-seq data (with potentially thousands of open chromatin sites per cell), direct analysis of these raw data is not only computationally expensive but also difficult to intuitively grasp the patterns and structures within the data.
Low-dimensional embedding methods such as t-distributed Stochastic Neighbor Embedding (t-SNE), Principal Component Analysis (PCA), Uniform Manifold Approximation and Projection (UMAP), or Locally Linear Embedding (LLE) are employed to mitigate this complexity. These techniques aim to preserve important structures and neighborhood relationships within the data while reducing the dimensionality, allowing the data to be visualized in two or three-dimensional plots for researchers to observe clustering of cell populations, continuous trends, or specific characteristics of cell types.
In the analysis of scATAC-seq data, low-dimensional embedding representations aid in discovering cell subpopulations, deciphering cell differentiation trajectories, and inferring relationships between chromatin states and gene expression regulation. Through this approach, researchers can extract meaningful biological insights from the vast and complex single-cell epigenetic data.
What features CASHeart?
- Comprehensive collection of human cardiac chromatin accessibility.
- Hierarchical categorization of scATAC data.
- Comprehensive annotation of scATAC data.
- User-friendly functionalities.
- The current version of CASHeart comprises two large datasets, encompassing 9 samples and 30 cell types, amounting to a total of 105,704 cells.
- CASHeart organizes diverse data into hierarchical trees, facilitating intuitive browsing and downloading.
- CASHeart encompasses rich annotation information, including barcode, cell type, sample ID, dataset name, age class, and open ratio.
- CASHeart provides user-friendly features such as distinctive visualization of cell type and statistical measures on the Brower page, advanced searching on the Search page, convenient data downloading on the Download page and exemplary analysis on the Analysis page.